CHAPTER 2. REMOTE SERVER CONFIG FOR LOG SHIPING (FILEBEAT)
Part 2.1. Filebeat install and config build-in modules for remote log shipping
Part 2.2. Filebeat setup for custom file read and log shipping
Part 2.1. Filebeat install and config build-in modules for remote log shipping.
An example of setting up filebeat is shown on nginx web server logs. The easiest way to transfer logs to remote host is using the built-in “filebeat” modules.
Log in (ssh) to the web server with nginx (195.168.33.95). And add elasticsearch repository: create file and copy the text into it:
sudo vi /etc/yum.repos.d/elk.repo
[elasticsearch-7.x]
name=Elastic repository for 7.x packages
baseurl=https://artifacts.elastic.co/packages/7.x/yum
gpgcheck=1
gpgkey=https://artifacts.elastic.co/GPG-KEY-elasticsearch
enabled=1
autorefresh=1
type=rpm-md
Save file and exit “vi” editor. Then run the command:
sudo yum install filebeat -y
Edit default filebeat config. Disable output to local elasticsearch (section Elasticsearch Output) and set remote elasticsearch ip 192.168.33.90 and logstash port 5044 in the section Logstash Output.
sudo vi /etc/filebeat/filebeat.yml
...
# ---------------------------- Elasticsearch Output ----------------------------
#output.elasticsearch:
  # Array of hosts to connect to.
#  hosts: ["localhost:9200"]

  # Protocol - either `http` (default) or `https`.
  #protocol: "https"

  # Authentication credentials - either API key or username/password.
  #api_key: "id:api_key"
  #username: "elastic"
  #password: "changeme"

# ------------------------------ Logstash Output -------------------------------
output.logstash:
  # The Logstash hosts
hosts: ["192.168.33.90:5044"]
...
Save file and exit “vi” editor. Enable nginx, auditd module in filebeat to read nginx and linux audit logs:
sudo filebeat modules enable nginx
sudo filebeat modules enable auditd
Start and enable autorun for filebeat
sudo systemctl start filebeat
sudo systemctl enable filebeat
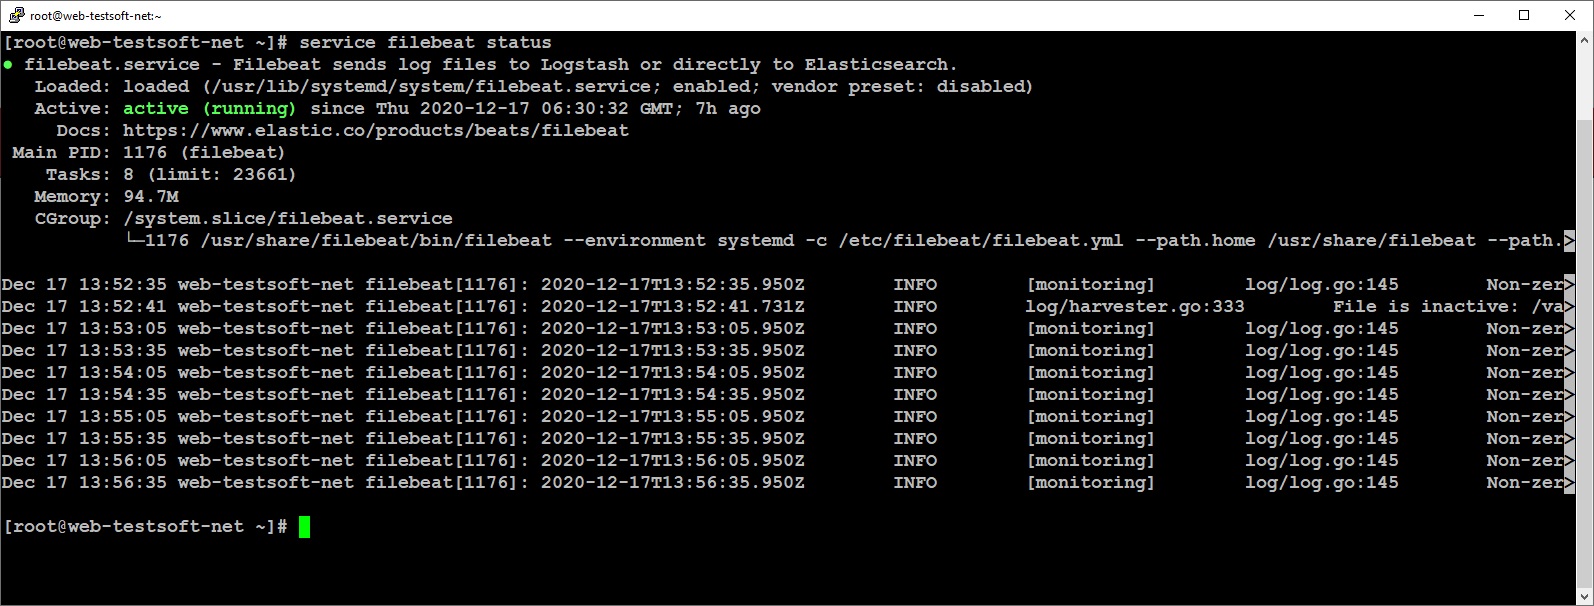
Check the filebeat is running:
sudo service filebeat status
You can view all available modules in filebeat:
sudo filebeat modules list
To enable or disable modules:
sudo filebeat modules enable system
sudo filebeat modules disable system
After all config changes restart filebeat:
sudo service filebeat restart
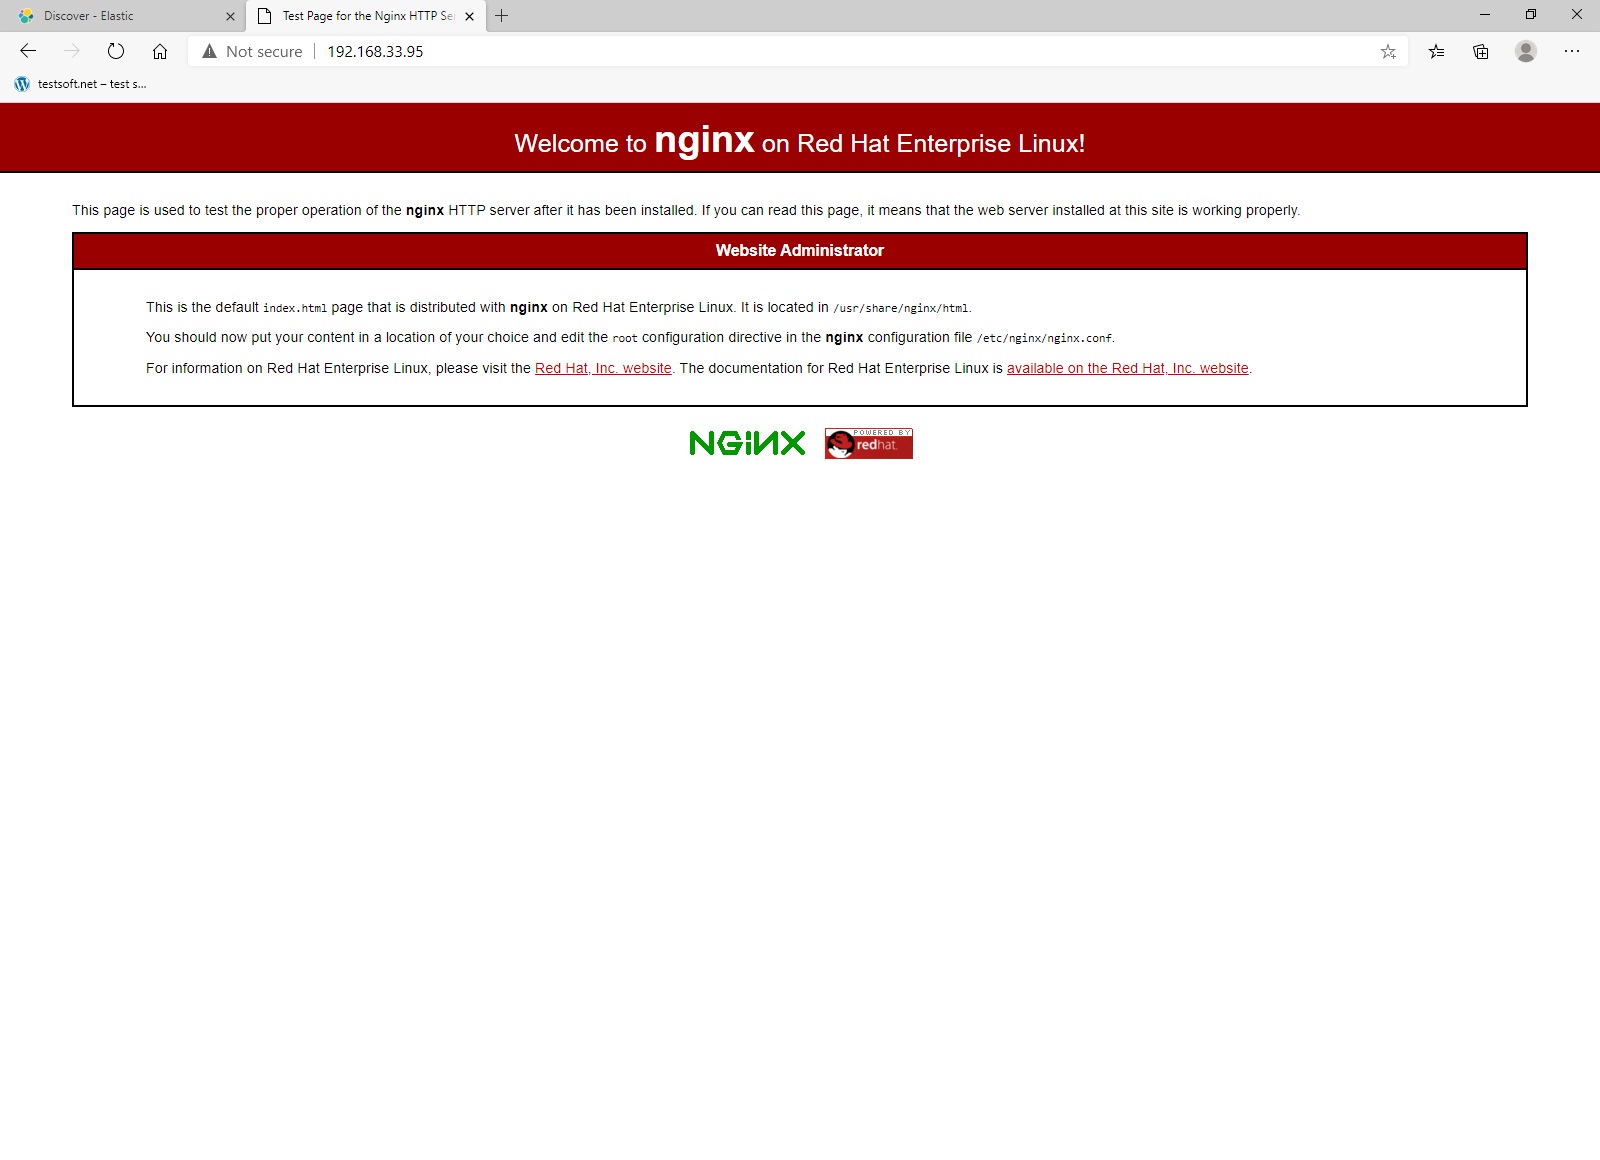
Open web server page address in browser: http://192.168.33.95/ and refresh the page several times. When open kibana and enter web server ip address 192.168.33.95 in KQL string:
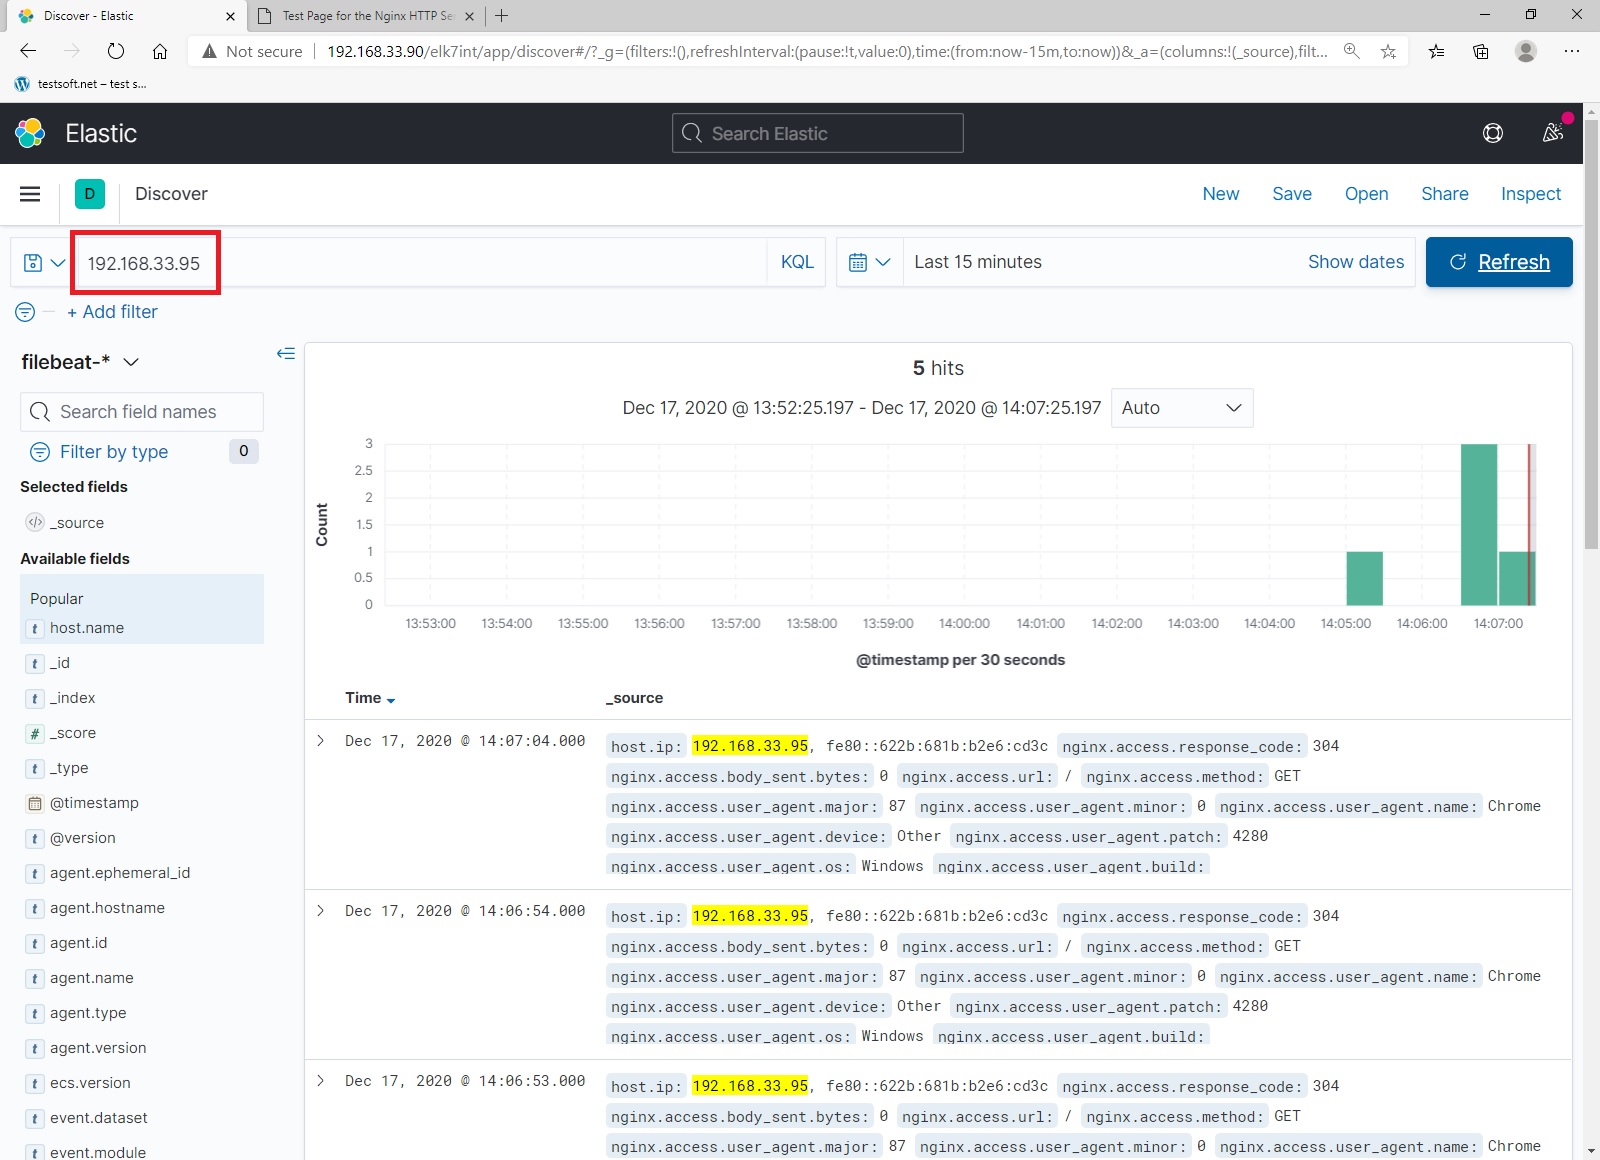
Excellent, you have configured web server to ship logs to remote elasticseach.
Part 2.2. Filebeat setup for custom file read and log shipping.
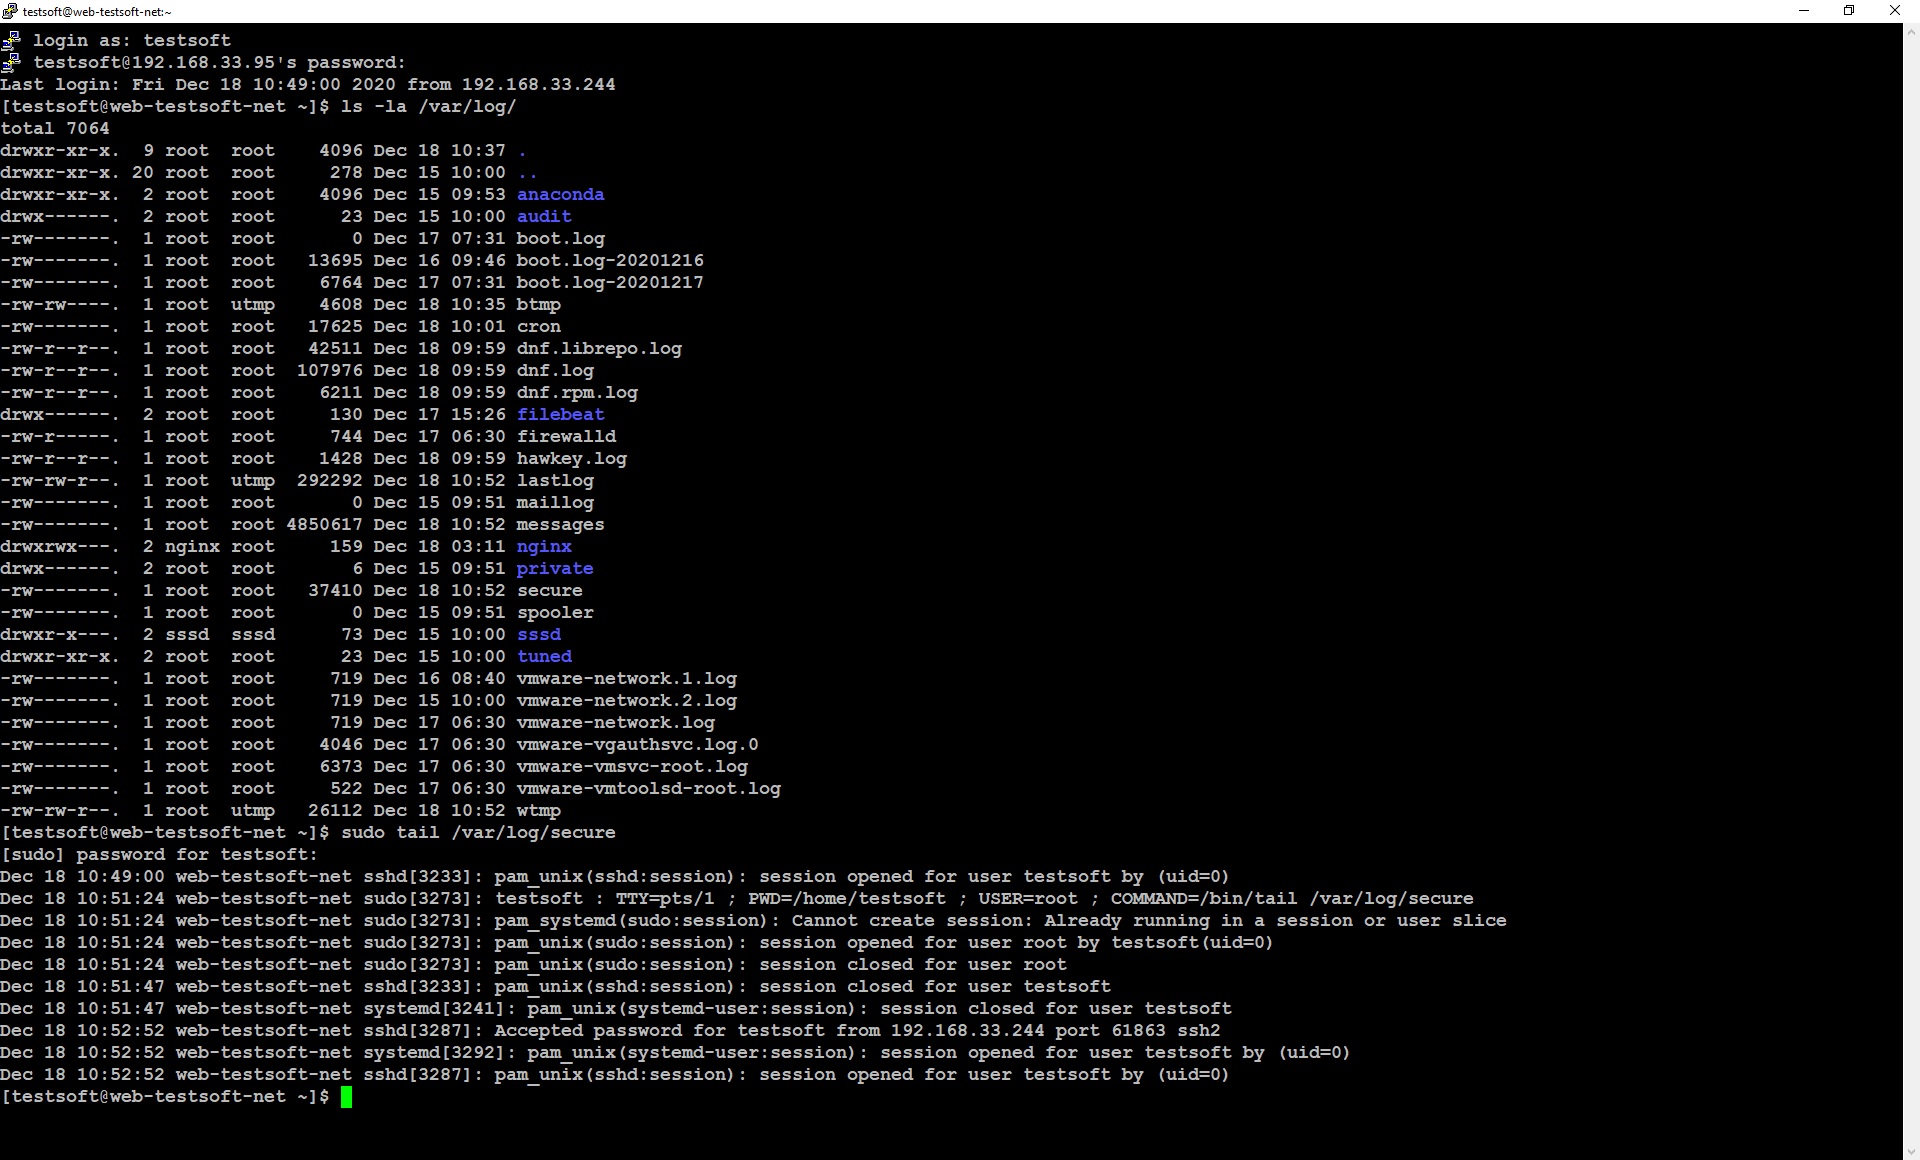
To ship any log files, you need to specify where filebeat should read the logs from. You can do this in configuration file “/etc/filebeat/filebeat.yml”. I’ll show example on the log file “secure”, which is located in the standard linux directory “/var/log/”. Log in (ssh) to web server (195.168.33.95).
View linux log directory
sudo ls -la /var/log/
View last ten lines of log file “secure”
sudo tail /var/log/secure
Now you can see standard linux security log looks like (Picture 2.2.1), so let’s send this data to elasticsearch.

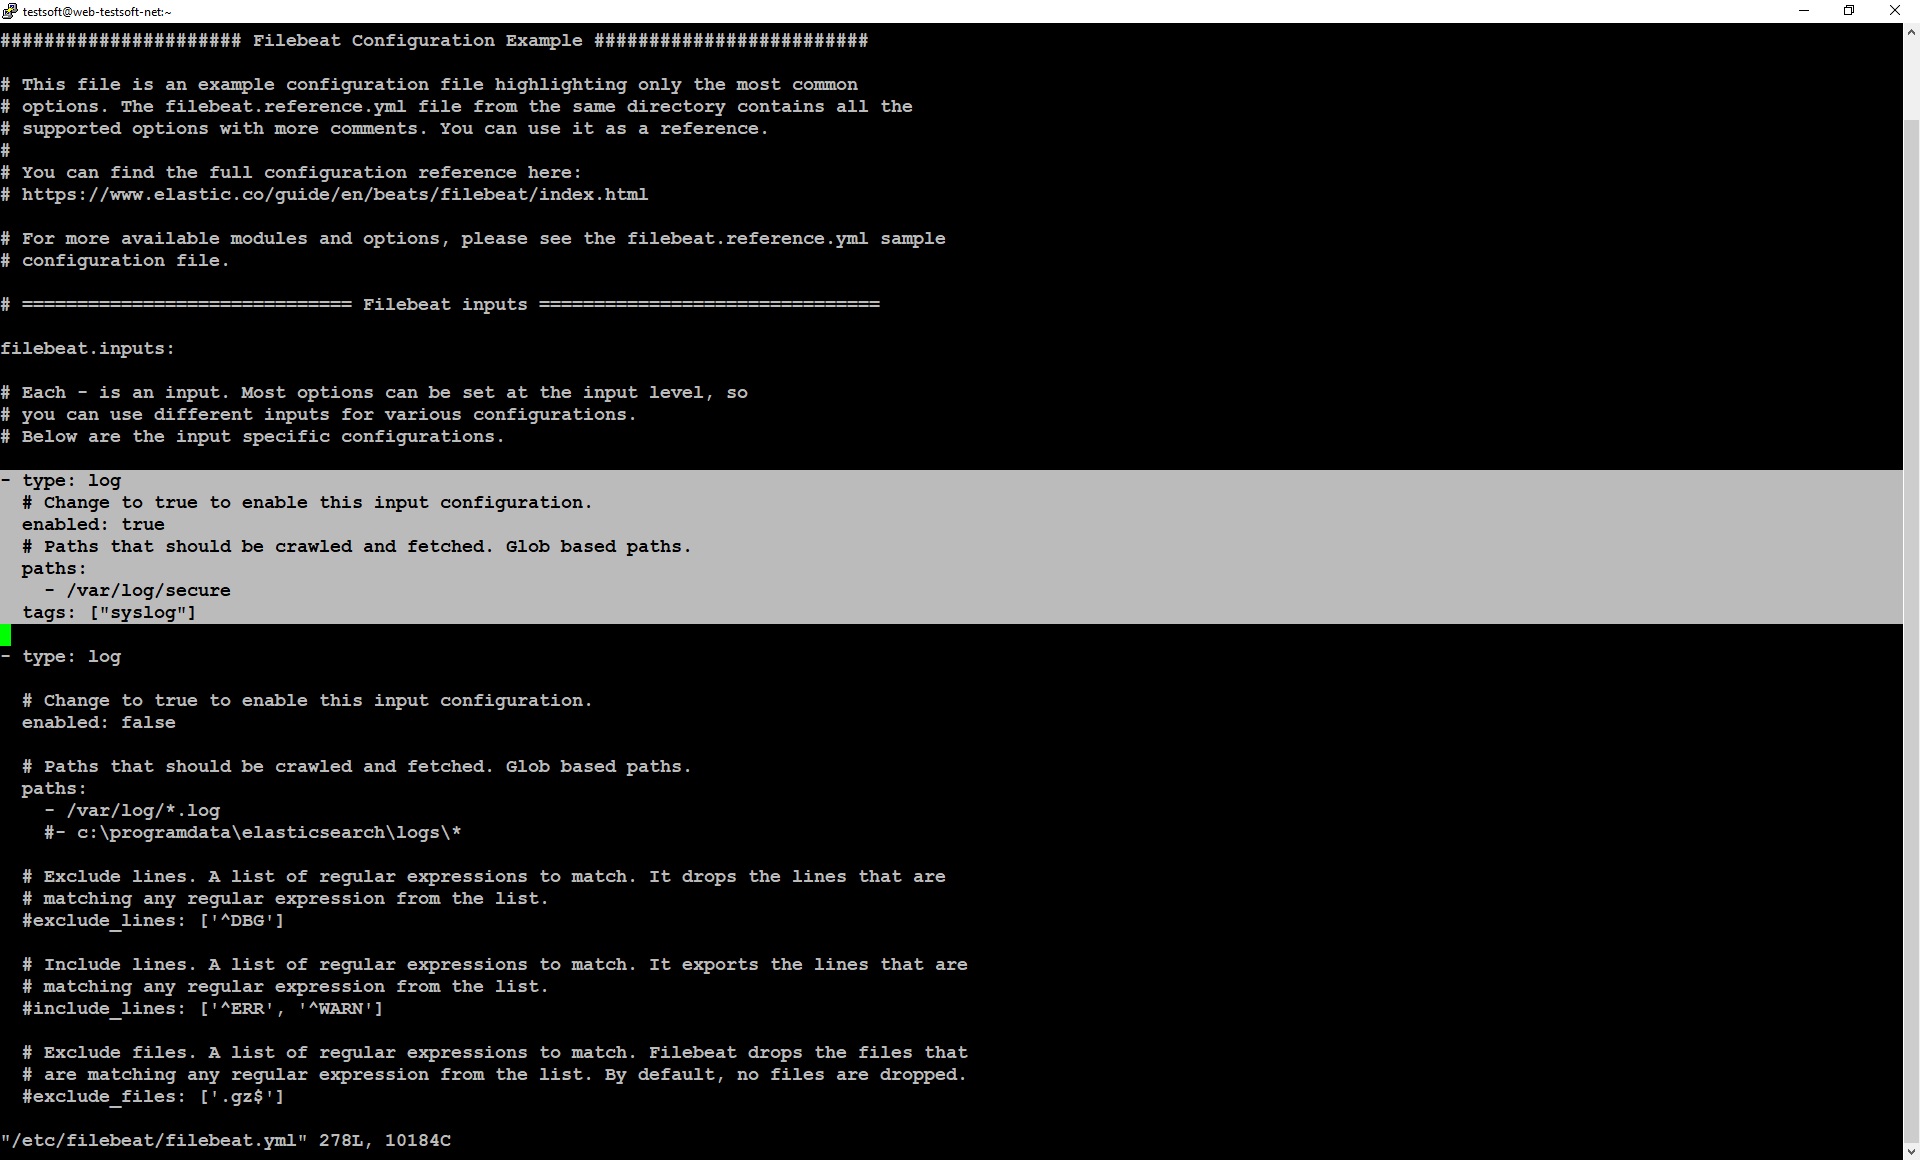
Open file “filebeat.yml” for edit and add lines (Picture 2.2.2):
sudo vi /etc/filebeat/filebeat.yml
...
- type: log
  # Change to true to enable this input configuration.
  enabled: true
  # Paths that should be crawled and fetched. Glob based paths.
  paths:
    - /var/log/secure
  tags: ["syslog"]
...
tags: [“syslog”] – in this example, I set tag “syslog”, because the file “secure” has a standard linux format – syslog. For your log files, you can set any value in the “tag” field. In the following articles, I will tell how to use tags in logstash parsing.
Save file and exit “vi” editor. Don’t forget restart filebeat.
sudo service filebeat restart
Check filebeat is running ok
sudo service filebeat status
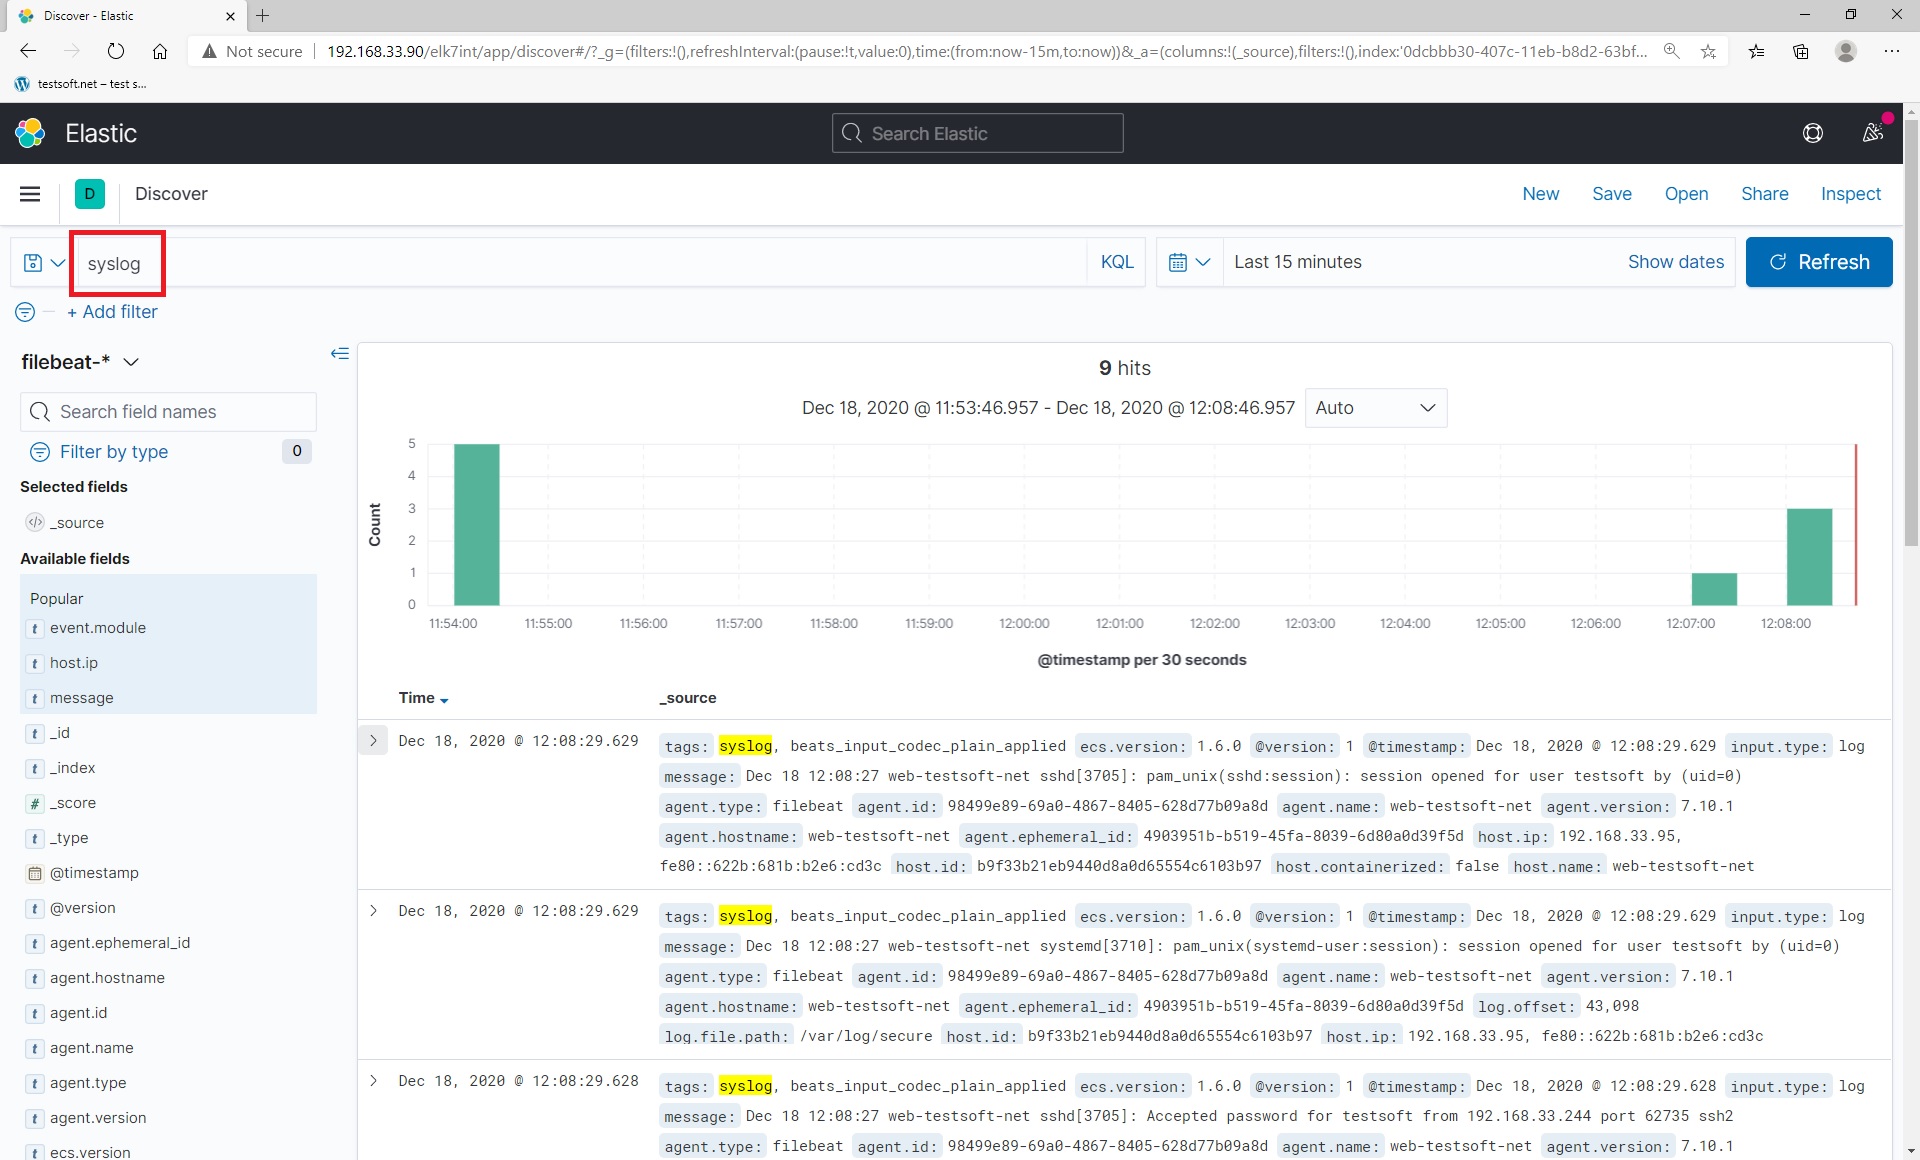
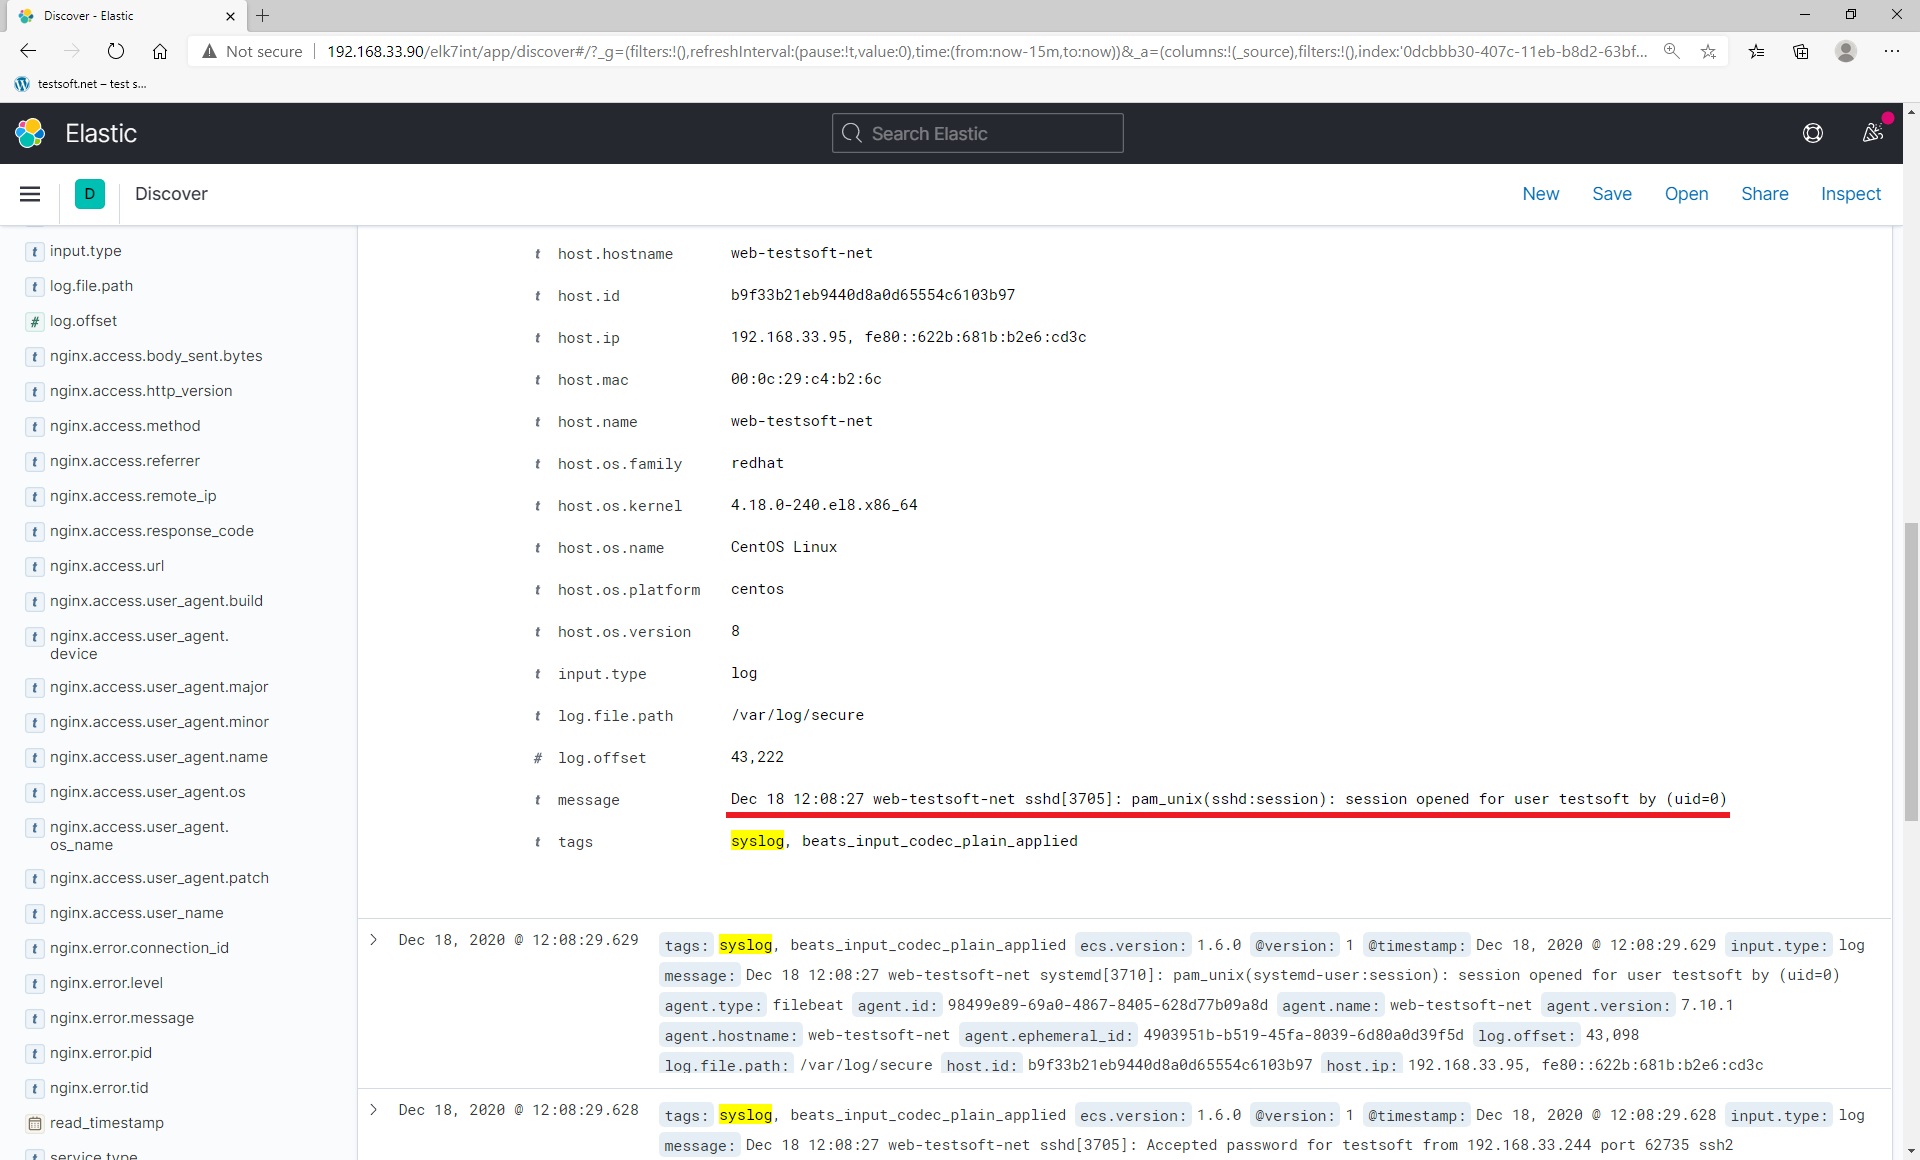
Now exit ssh session and relogin to web serever by ssh again. After relogin, open kibana url in browser: “http://192.168.33.90/elk7int” and enter to elasticsearch. Next open “Discover” page, type “syslog” in KQL string and press “enter”. You will see your log lines from syslog file “secure” Picture (2.2.3, 2.2.4).
Now you have learned how to send any logs and data to elasticsearch by filebeat.
Additional information: how to install nginx webserver
Log in (ssh) to remote host web-testsoft-net (192.168.33.95) and install nginx:
yum install nginx -y
Open firewall for http (port 80)
sudo firewall-cmd --permanent --zone=public --add-service=http
sudo firewall-cmd --reload
Start nginx
sudo systemctl start nginx
Enable autorun
sudo systemctl enable nginx
Check nginx status
sudo service nginx status
Open web address in browser: http://192.168.33.95/
CHAPTER 1. INSTALL AND CONFIG ELASTICSEARCH, LOGSTASH, KIBANA
Part 1.1. Install elastic search
Part 1.2. Install kibana and nginx proxy
Part 1.3. Install logstash on local ELK server
Part 1.4. Install filebeat for local ELK loging
Part 1.5. Create index for filebeat

CHAPTER 2. REMOTE SERVER CONFIG FOR LOG SHIPING (FILEBEAT)
Part 2.1. Filebeat install and config build-in modules for remote log shipping
Part 2.2. Filebeat setup for custom file read and log shipping