CHAPTER 1. INSTALL AND CONFIG ELASTICSEARCH, LOGSTASH, KIBANA
Part 1.1. Install elastic search
Part 1.2. Install kibana and nginx proxy
Part 1.3. Install logstash on local ELK server
Part 1.4. Install filebeat for local ELK loging
Part 1.5. Create index for filebeat
Sequence of commands for installing and configure Elasticsearch 7.x on Centos (minimal serever install) with nginx proxy. Also in this article I will tell you how to configure log receive from remote web server (nginx).
Lab config:
1. Elk server (elasticsearch, logstash, kibana, filebeat, nginx)
hostname: elk-testsoft-net
server ip: 192.168.33.90
centos 8.3 virtual host vmware esxi
cpu 4 (i5 4570) / ram 16 Gb / ssd 128 Gb
2. Web server (nginx)
hostname: web-testsoft-net
server ip: 192.168.33.95
centos 8.3 virtual host vmware esxi
CHAPTER 1. INSTALL AND CONFIG ELASTICSEARCH, LOGSTASH, KIBANA
PART 1.1. INSTALL ELASTIC SEARCH
Install tcpdump, netstat for future network debug
sudo yum install tcpdump
Install java:
sudo yum install java-1.8.0-openjdk -y
sudo yum install java-1.8.0-openjdk-devel -y
Install elacticsearch:
sudo rpm --import https://artifacts.elastic.co/GPG-KEY-elasticsearch
Add elasticsearch repository: create file and copy the text into it:
sudo vi /etc/yum.repos.d/elk.repo
[elasticsearch-7.x]
name=Elastic repository for 7.x packages
baseurl=https://artifacts.elastic.co/packages/7.x/yum
gpgcheck=1
gpgkey=https://artifacts.elastic.co/GPG-KEY-elasticsearch
enabled=1
autorefresh=1
type=rpm-md
Save file and exit “vi” editor. Getting started with the installation:
sudo yum install elasticsearch -y
Open the settings file and edit lines:
sudo vi /etc/elasticsearch/elasticsearch.yml
...
network.host: localhost
...
localport:9200
...
Save file and exit “vi” editor. Start elasticsearch
sudo systemctl start elasticsearch
Add elasticsearch to autostart when the operating system starts
sudo systemctl enable elasticsearch
Checking elasticsearch, output text must be like this:
sudo curl -X GET "localhost:9200"
{
"name" : "elk7int",
"cluster_name" : "elasticsearch",
"cluster_uuid" : "rT212z32T4yM5W16V7-mdg",
"version" : {
"number" : "7.10.1",
"build_flavor" : "default",
"build_type" : "rpm",
"build_hash" : "1c34207366d4db5211666735187069df598706aa",
"build_date" : "2020-12-05T01:00:33.671820Z",
"build_snapshot" : false,
"lucene_version" : "8.7.0",
"minimum_wire_compatibility_version" : "6.8.0",
"minimum_index_compatibility_version" : "6.0.0-beta1"
},
"tagline" : "You Know, for Search"
}
PART 1.2. INSTALL KIBANA AND NGINX PROXY
Install kibana:
sudo yum install kibana -y
Open the settings file and edit lines:
sudo vi /etc/kibana/kibana.yml
...
server.port: 5601
...
server.host: "localhost"
...
server.basePath: "/elk7int"
...
Save file and exit “vi” editor. Don’t start Kibana now.
Install nginx
yum install nginx -y
If you see error: nginx not found, run “yum install epel-release -y” and run install nginx.
Set login “elk7int” and password for nginx access:
echo "elk7int:`openssl passwd -apr1`" | sudo tee -a /etc/nginx/htpasswd.users
Open nginx config file:
vi /etc/nginx/nginx.conf
Disable IPv6 if you don’t use it, comment line “listen [::]:80…”. And paste new section “location /elk7int” in nginx config:
...
    # Load modular configuration files from the /etc/nginx/conf.d directory.
    # See http://nginx.org/en/docs/ngx_core_module.html#include
    # for more information.
    include /etc/nginx/conf.d/*.conf;

    server {
        listen       80 default_server;
#       listen       [::]:80 default_server;
        server_name  elk7int;
        root         /usr/share/nginx/html;

        # Load configuration files for the default server block.
        include /etc/nginx/default.d/*.conf;

        location /elk7int {
        auth_basic "Restricted Access";
        auth_basic_user_file /etc/nginx/htpasswd.users;
        rewrite ^/elk7int/(.*) /$1 break;
        proxy_ignore_client_abort on;
        proxy_pass http://localhost:5601/;
        proxy_set_header X-Real-IP $remote_addr;
        proxy_set_header X-Forwarded-For $proxy_add_x_forwarded_for;
        proxy_set_header Host $http_host;
        }

        location / {
        }

        error_page 404 /404.html;
            location = /40x.html {
        }

        error_page 500 502 503 504 /50x.html;
            location = /50x.html {
        }
    }
Save file and exit “vi” editor.
if you want to completely close access to the entire server, move the two lines that starts with “auth_basic” above “location /elk7int”
Set connection settings for nginx
sudo setsebool httpd_can_network_connect 1 -P
Open firewall for nginx access:
sudo firewall-cmd --permanent --zone=public --add-service=http
sudo firewall-cmd --reload
Start nginx and kibana
sudo systemctl start nginx
sudo systemctl enable nginx
sudo systemctl start kibana
sudo systemctl enable kibana
PART 1.3. INSTALL LOGSTASH ON LOCAL ELK SERVER
sudo yum install logstash -y
Create input config file (simple start without ssl). Logstash will receive logs from remote hosts by port 5044. I used the filter configuration for nginx from the official elasticsearch site, but modified it a bit – disable the message remove (for better debug). This simple filter will help you understand the basic principle of data parsing in logstash.
sudo vi /etc/logstash/conf.d/input.conf
input   {
                beats {
                port => 5044
                ssl => false
        }
}

filter {

    if [event][module] == "nginx" {
    if [fileset][name] == "access" {
      grok {
        match => { "message" => ["%{IPORHOST:[nginx][access][remote_ip]} - %{DATA:[nginx][access][user_name]} \[%{HTTPDATE:[nginx][access][time]}\] \"%{WORD:[nginx][access][method]} %{DATA:[nginx][access][url]} HTTP/%{NUMBER:[nginx][access][http_version]}\" %{NUMBER:[nginx][access][response_code]} %{NUMBER:[nginx][access][body_sent][bytes]} \"%{DATA:[nginx][access][referrer]}\" \"%{DATA:[nginx][access][agent]}\""] }
#        remove_field => "message"
      }
      mutate {
        add_field => { "read_timestamp" => "%{@timestamp}" }
      }
      date {
        match => [ "[nginx][access][time]", "dd/MMM/YYYY:H:m:s Z" ]
        remove_field => "[nginx][access][time]"
      }
      useragent {
        source => "[nginx][access][agent]"
        target => "[nginx][access][user_agent]"
        remove_field => "[nginx][access][agent]"
      }
      geoip {
        source => "[nginx][access][remote_ip]"
        target => "[nginx][access][geoip]"
      }
    }
    else if [fileset][name] == "error" {
      grok {
        match => { "message" => ["%{DATA:[nginx][error][time]} \[%{DATA:[nginx][error][level]}\] %{NUMBER:[nginx][error][pid]}#%{NUMBER:[nginx][error][tid]}: (\*%{NUMBER:[nginx][error][connection_id]} )?%{GREEDYDATA:[nginx][error][message]}"] }
#        remove_field => "message"
      }
      mutate {
        rename => { "@timestamp" => "read_timestamp" }
      }
      date {
        match => [ "[nginx][error][time]", "YYYY/MM/dd H:m:s" ]
        remove_field => "[nginx][error][time]"
      }
    }
  }
}
Save file and exit “vi” editor. Create output config file for local elasticsearch server:
sudo vi /etc/logstash/conf.d/output.conf
output {
        elasticsearch {
                hosts => ["localhost:9200"]
                manage_template => false
                index => "%{[@metadata][beat]}-%{[@metadata][version]}-%{+YYYY.MM.dd}"
        }
}
Save file and exit “vi” editor. Open port for log receive
sudo firewall-cmd --zone=public --add-port=5044/tcp --permanent
sudo firewall-cmd --reload
Start logstash
sudo systemctl start logstash
sudo systemctl enable logstash
PART 1.4. INSTALL FILEBEAT FOR LOCAL ELK LOGING
Install filebeat:
sudo yum install filebeat -y
Edit default filebeat config. Disable output to elasticsearch. Enable output to logstash.
sudo vi /etc/filebeat/filebeat.yml
...
# ---------------------------- Elasticsearch Output ----------------------------
#output.elasticsearch:
  # Array of hosts to connect to.
#  hosts: ["localhost:9200"]

  # Protocol - either `http` (default) or `https`.
  #protocol: "https"

  # Authentication credentials - either API key or username/password.
  #api_key: "id:api_key"
  #username: "elastic"
  #password: "changeme"

# ------------------------------ Logstash Output -------------------------------
output.logstash:
  # The Logstash hosts
  hosts: ["localhost:5044"]
...
Save file and exit “vi” editor. Enable nginx module in filebeat to read local nginx logs:
sudo filebeat modules enable nginx
Enable auditd module in filebeat to read linux audit events (ssh login and etc.)
sudo filebeat modules enable auditd
Start and enable autorun for filebeat
sudo systemctl start filebeat
sudo systemctl enable filebeat
Now you can open kibana on elk-testsoft-net server: http://192.168.33.90/elk7int
PART 1.5. CREATE INDEX FOR FILEBEAT
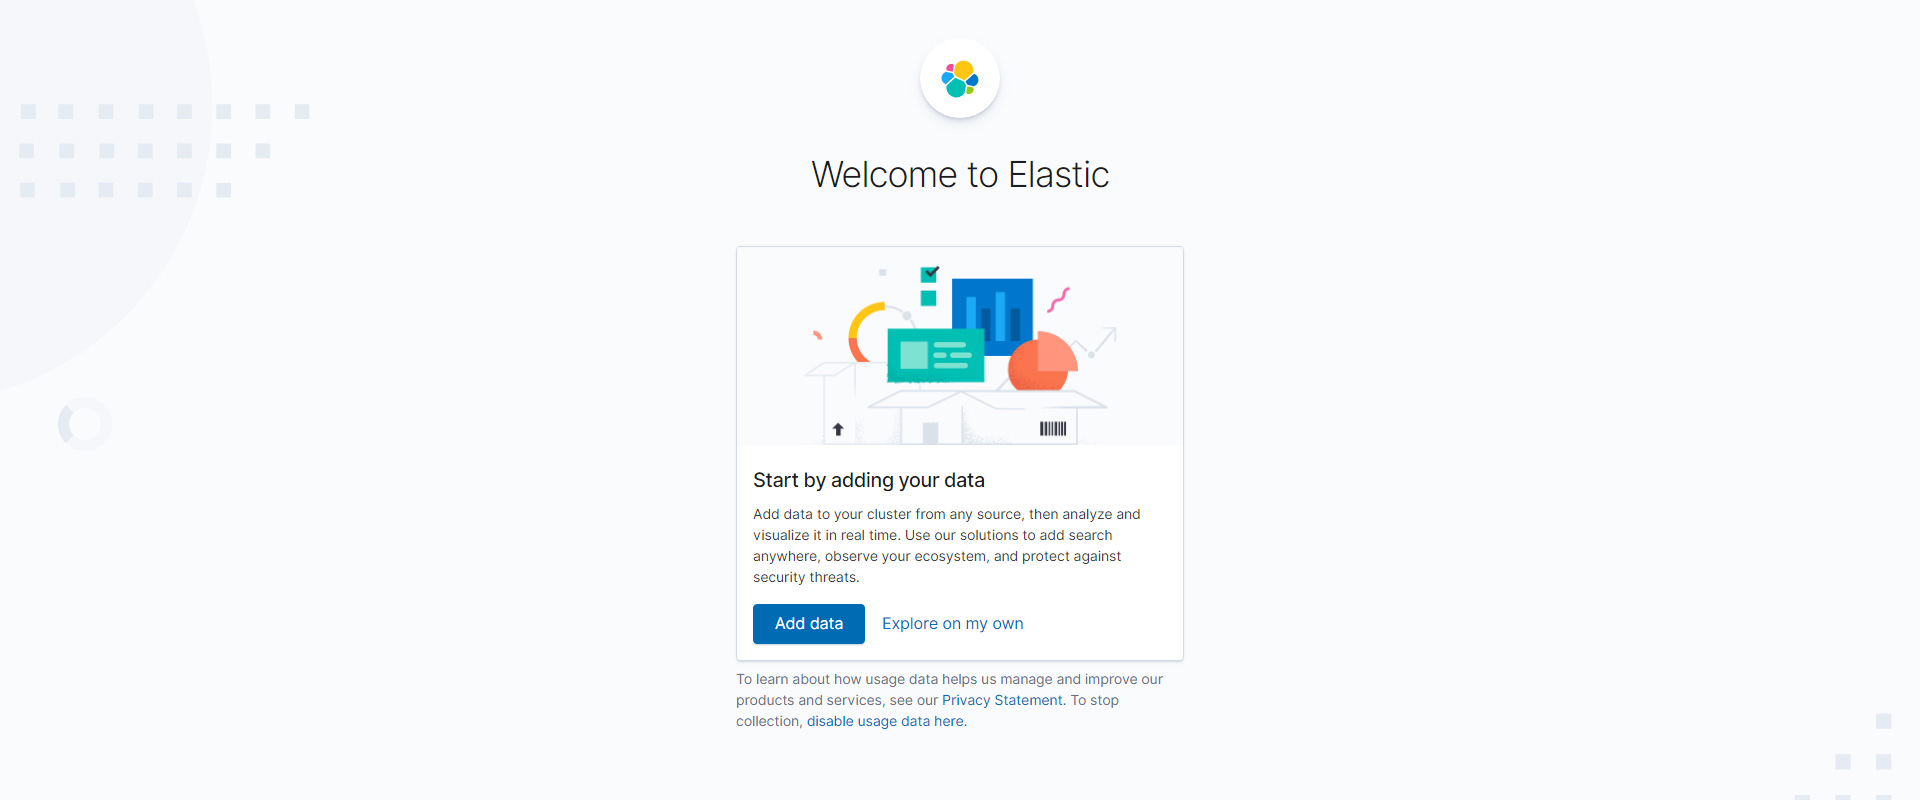
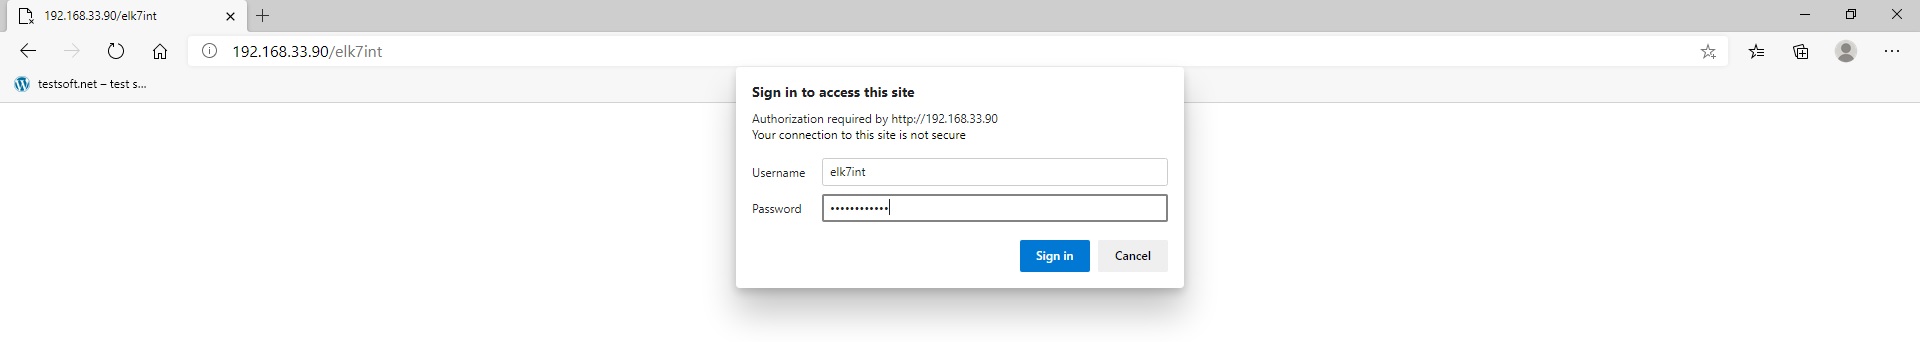
Open kibana url in browser: “http://192.168.33.90/elk7int”. Enter login “elk7int” and your password which you set in nginx config “STEP 2” (Picture 1).
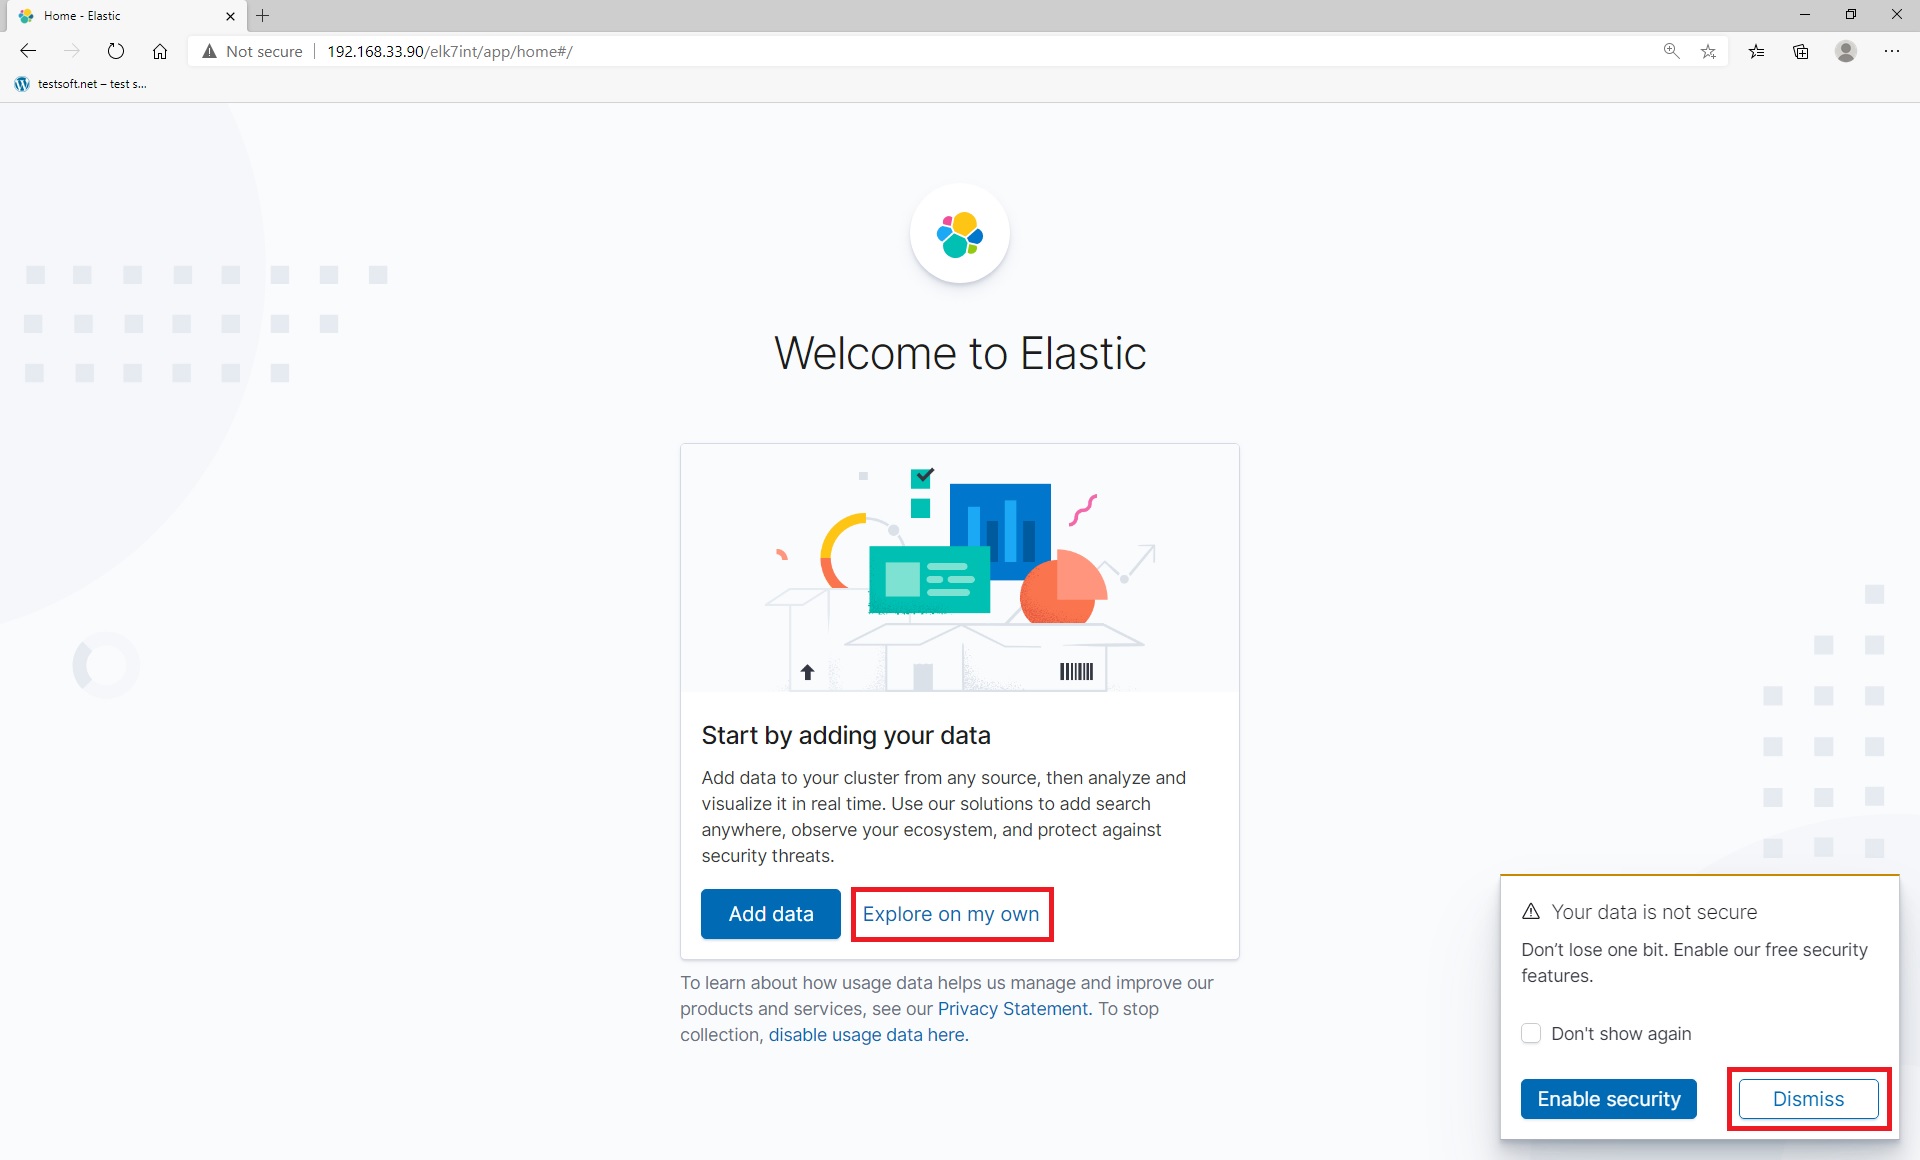
On welcome screen select “Dismiss” and “Explore on my own” (Picture 2).
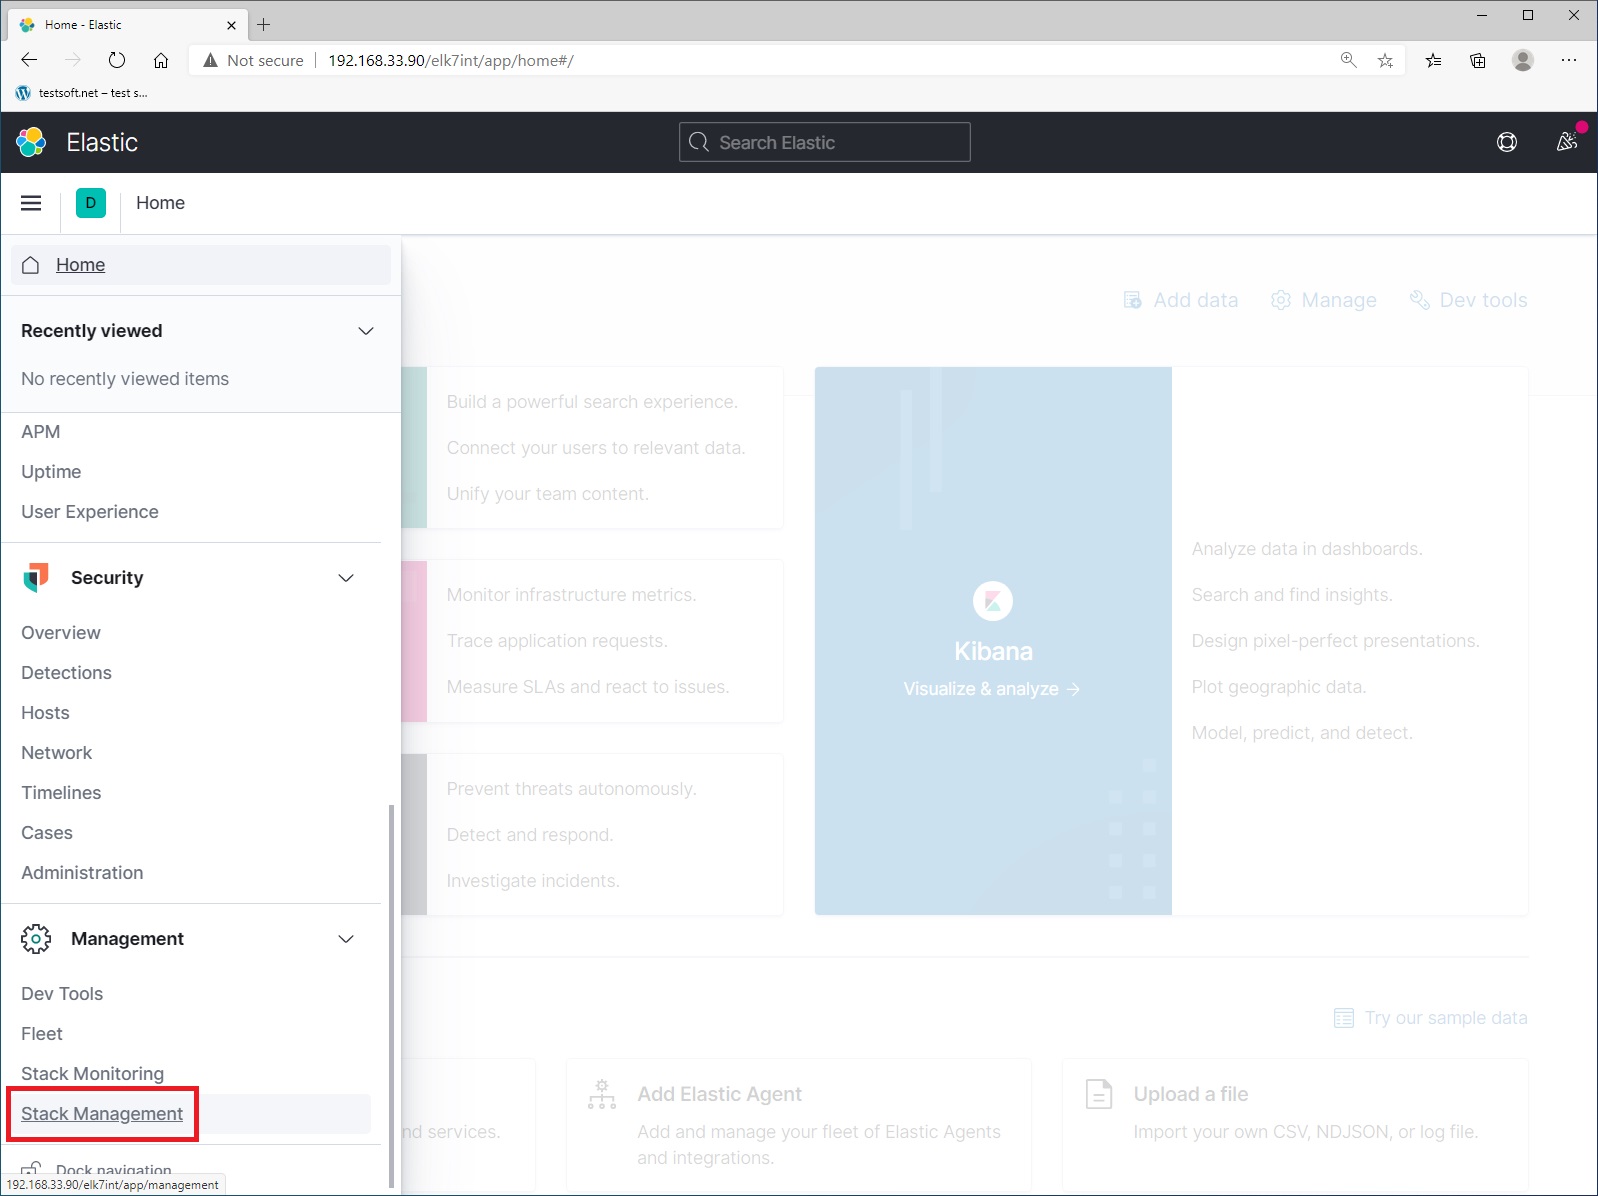
Next open left menu (up left side) and select “Stack Management” (Picture 3):
Next select menu item “Index Management” (Picture 4).
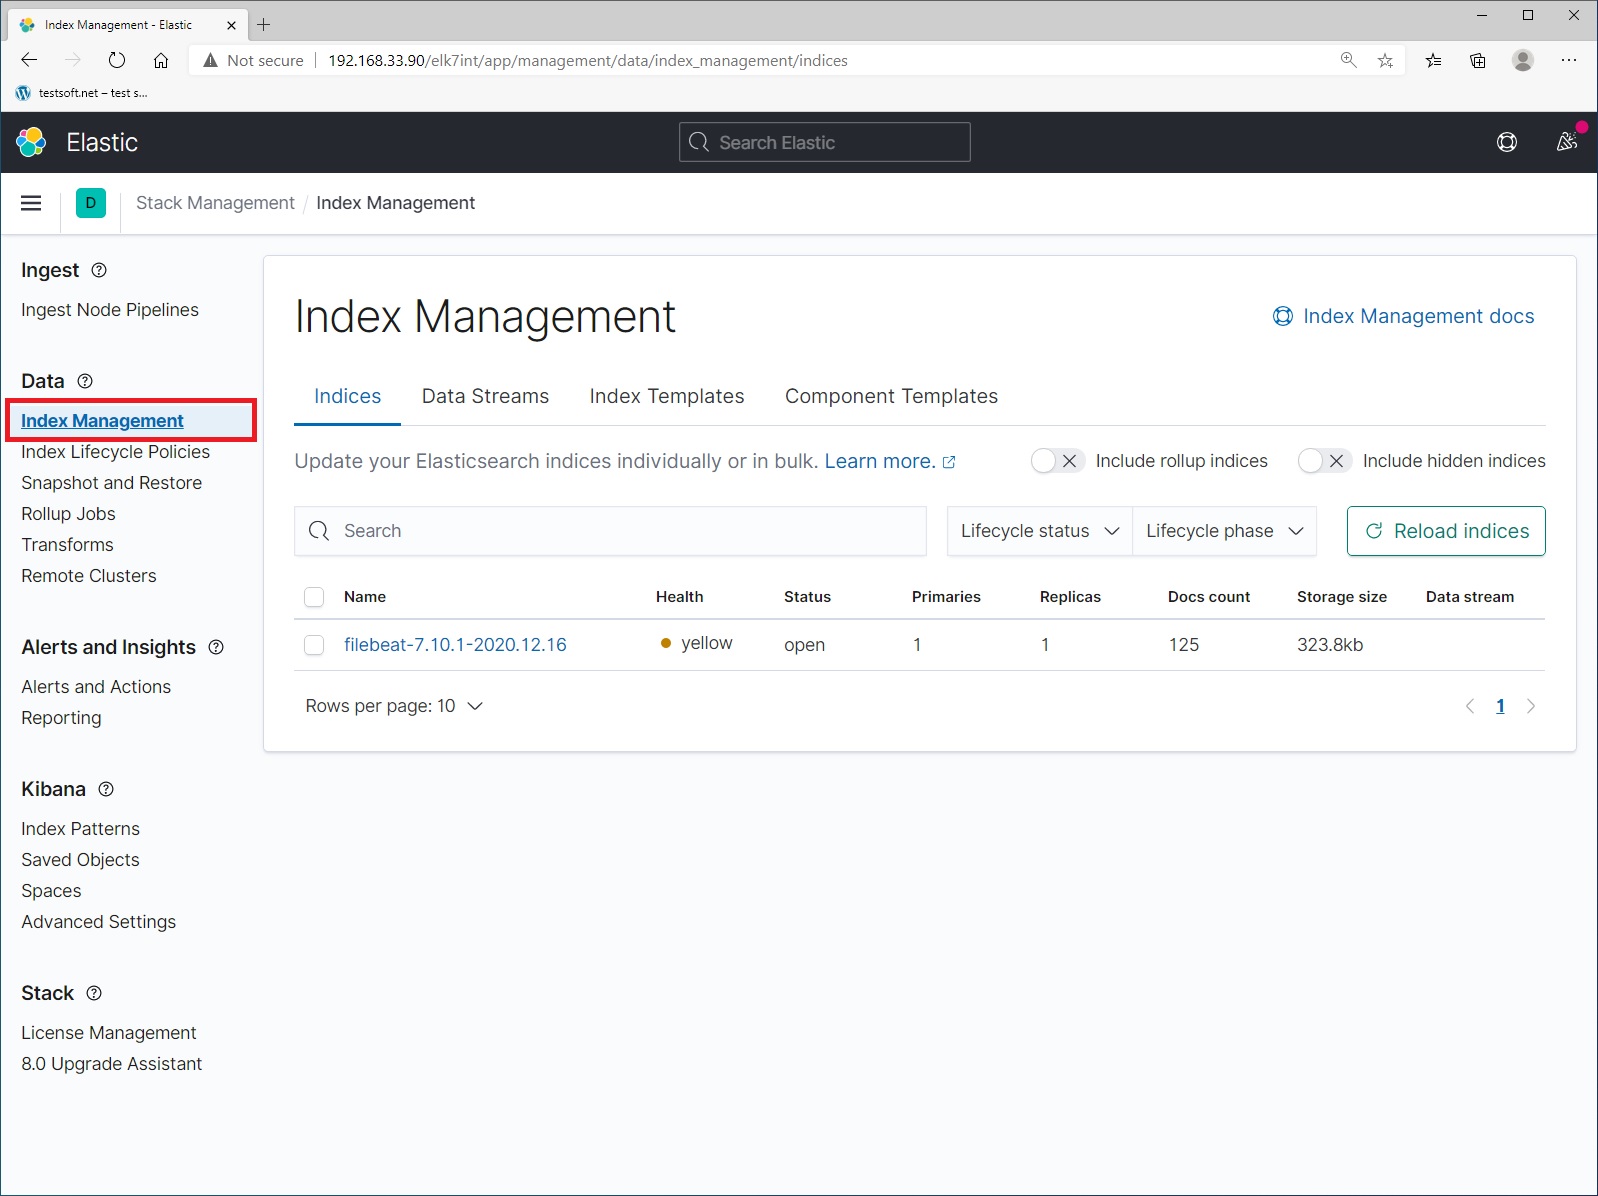
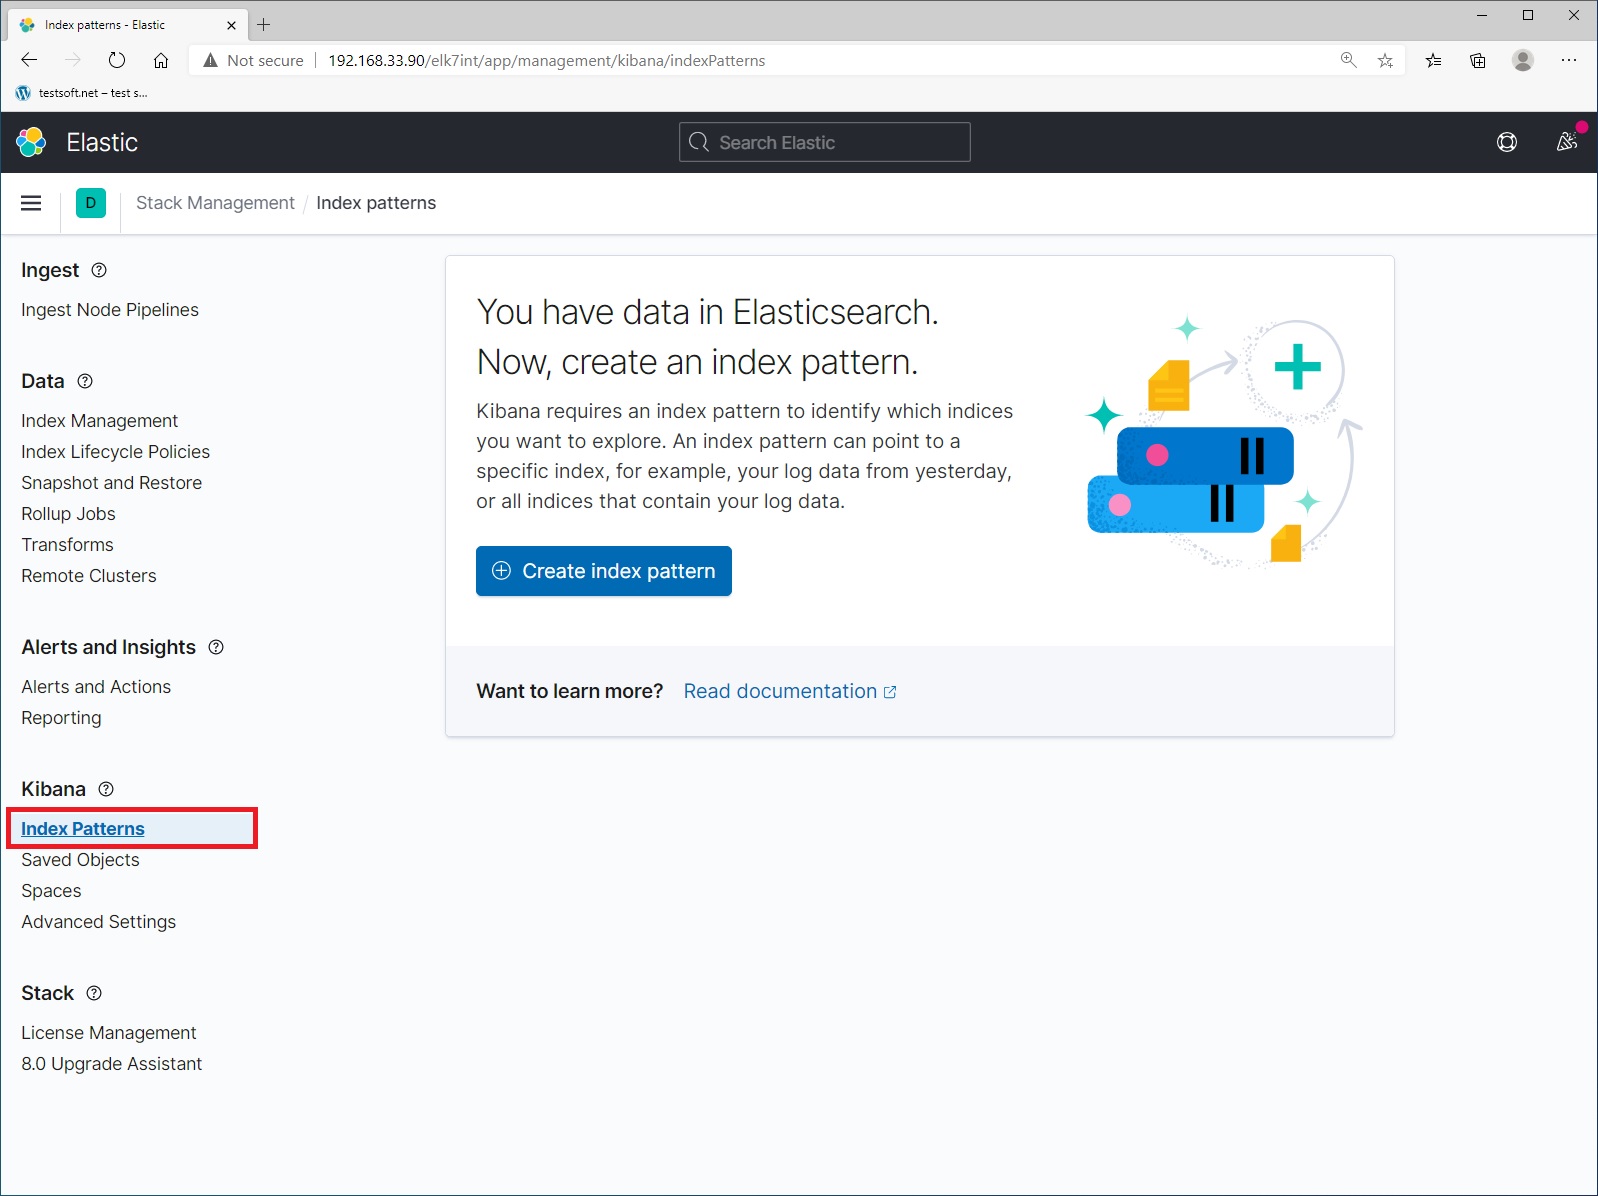
And check that the data is being sent to elasticsearch. The name of the index format – values in the file “/etc/logstash/conf.d/output.conf” that you created in step 4. The logs you are currently seeing are the history of your movements in the kibana and nginx web server. Now let’s create index pattern. Select menu item “Index Patterns” and click blue button “Create Index Pattern” (Picture 5).
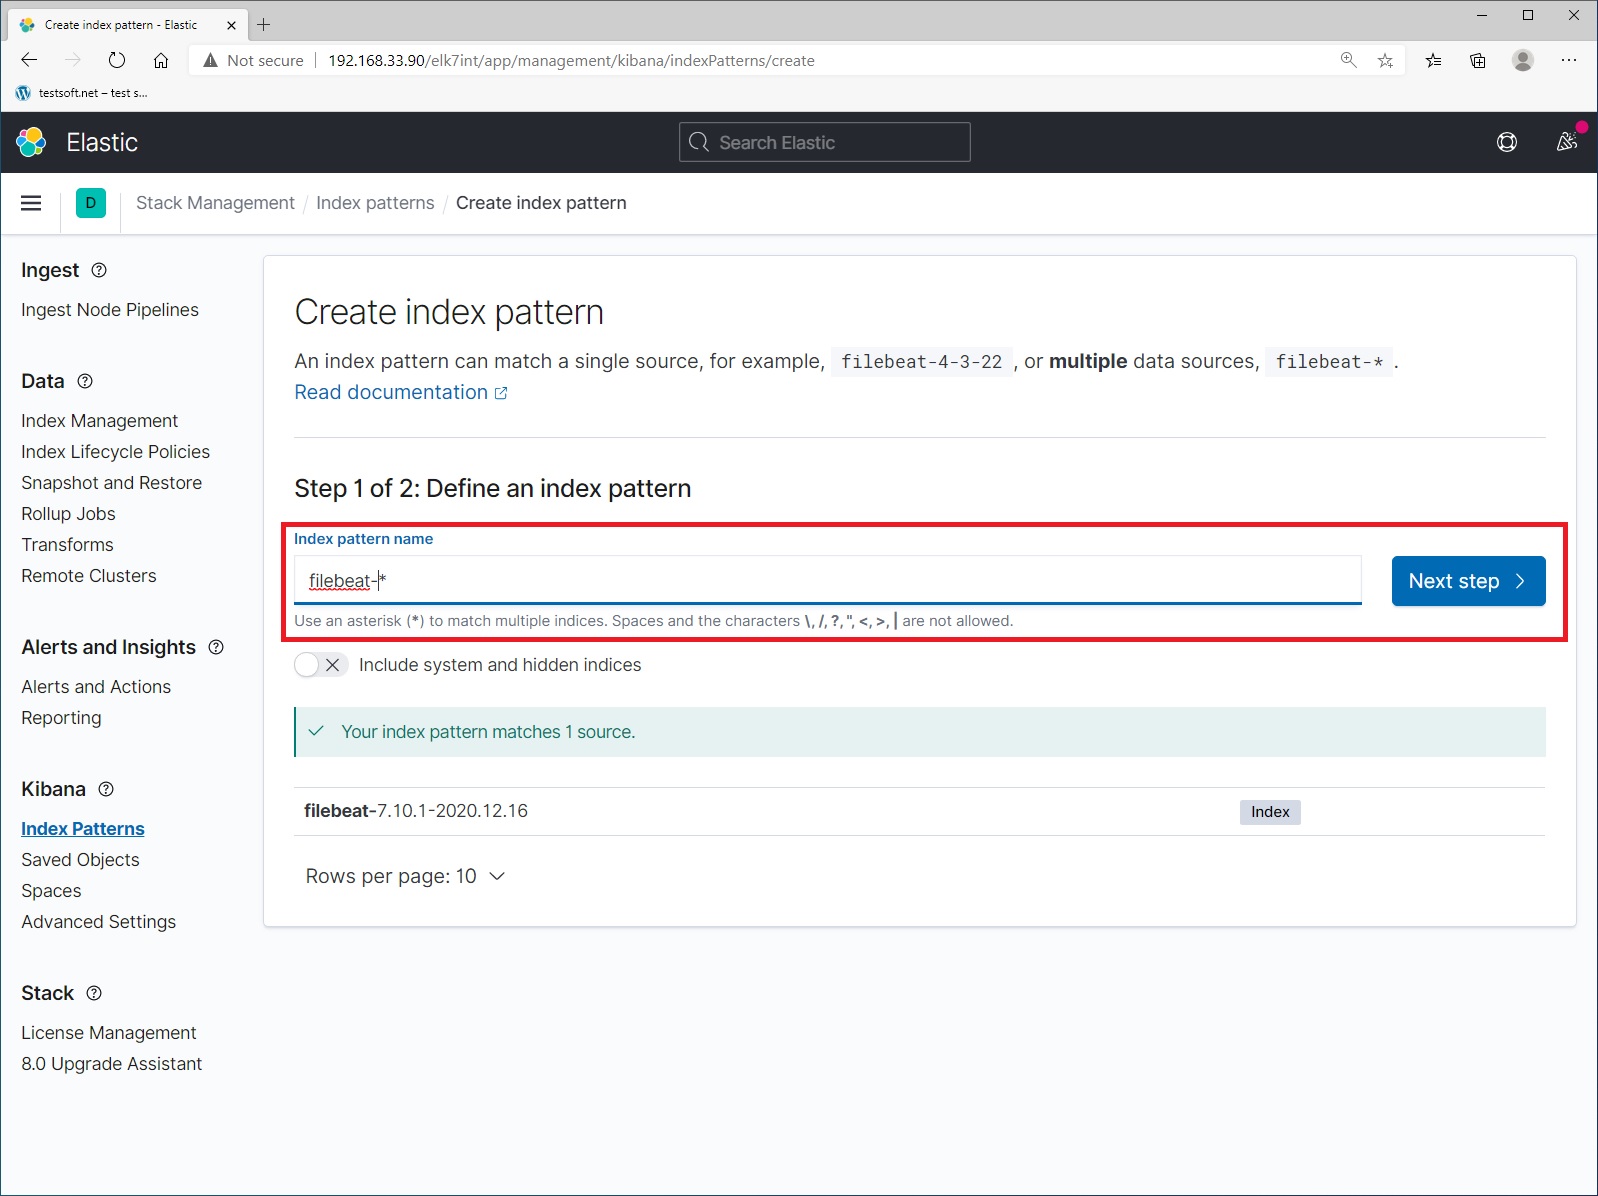
Step 1. Next enter index name “filebeat-*” and click “Next Step” (Picture 6).
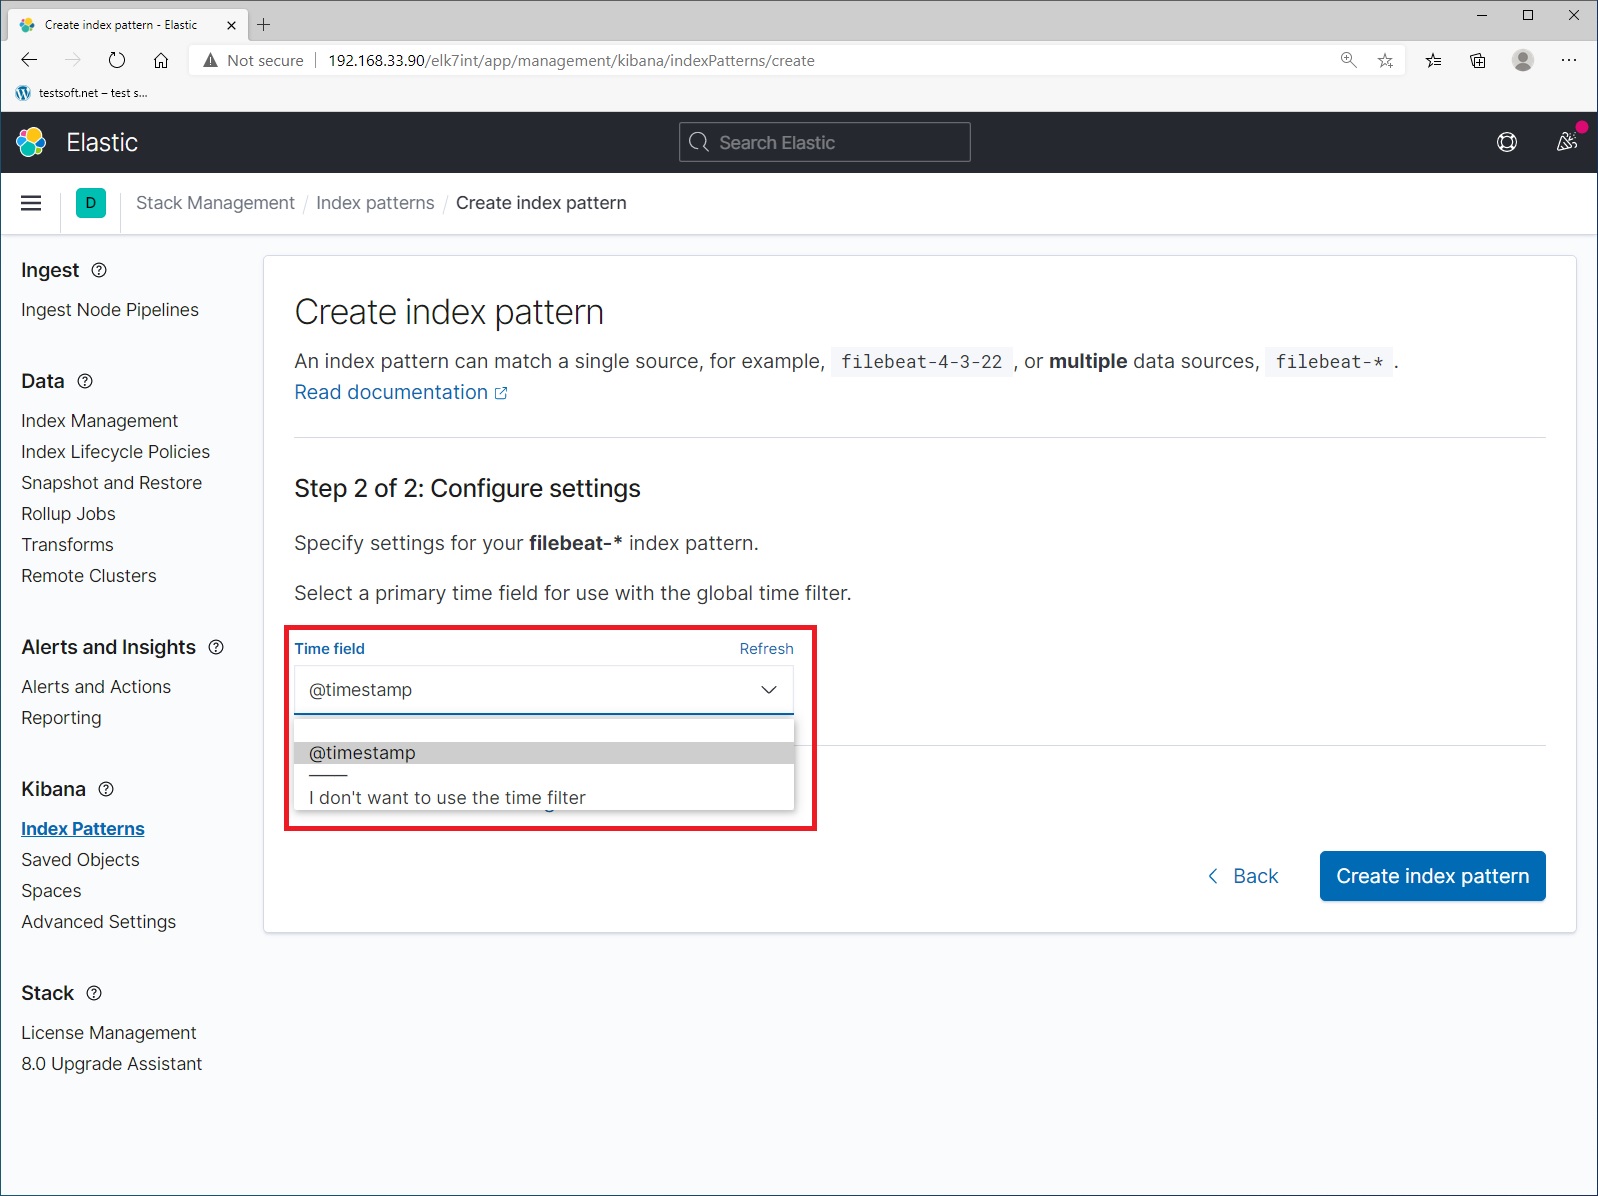
Step 2. Select time stamp field and press “Create index pattern” (Picture 7).
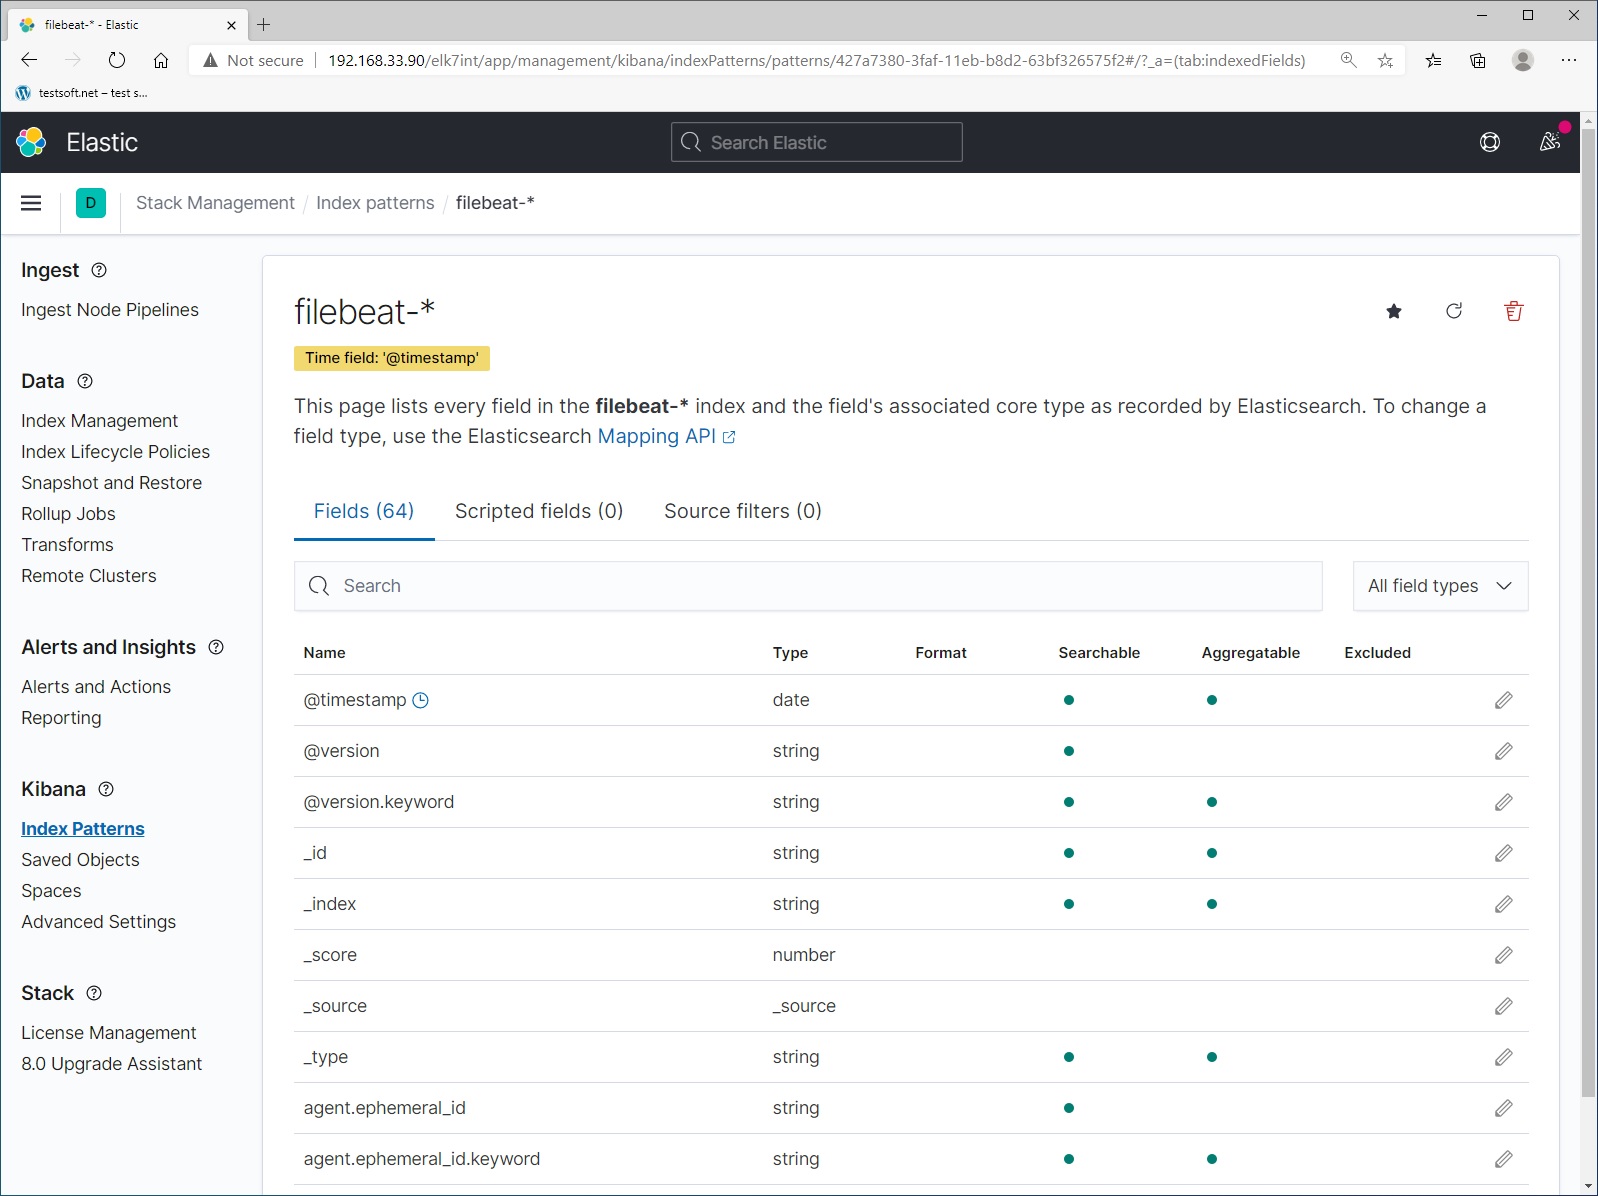
Сongratulations you have created your first index for filebeat (Picture 8).
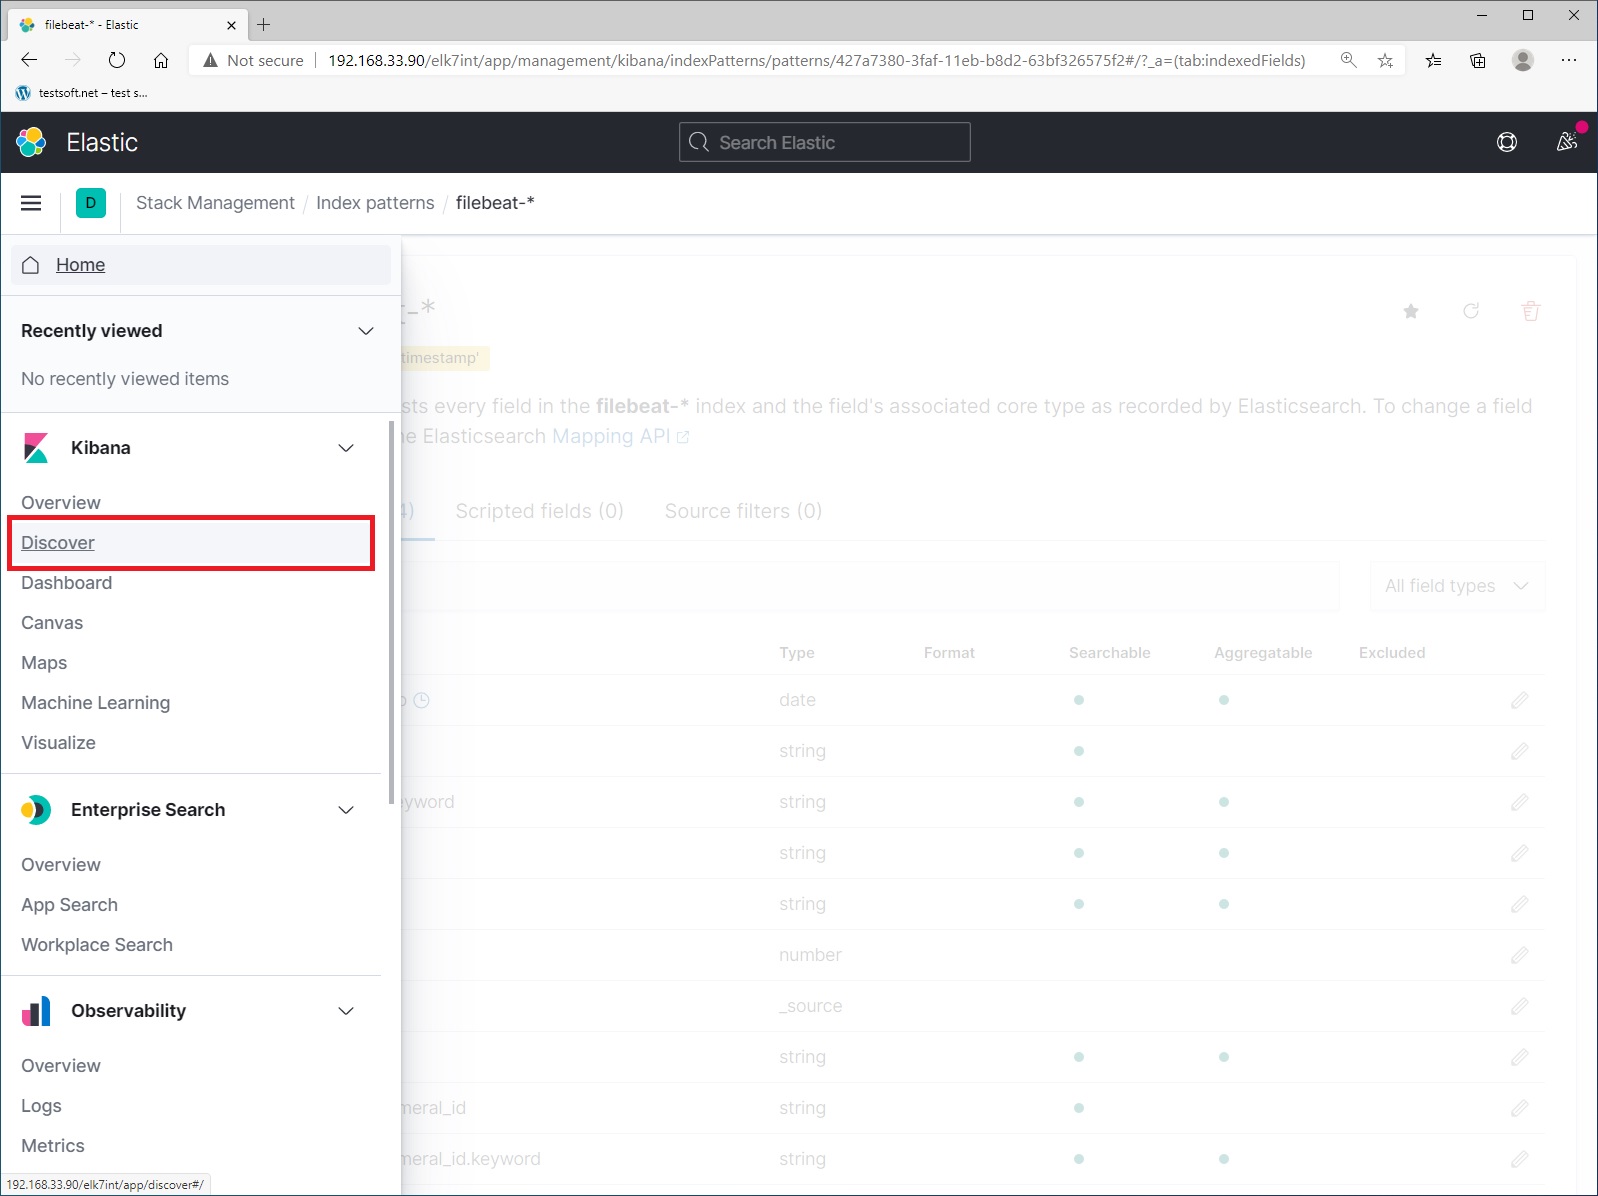
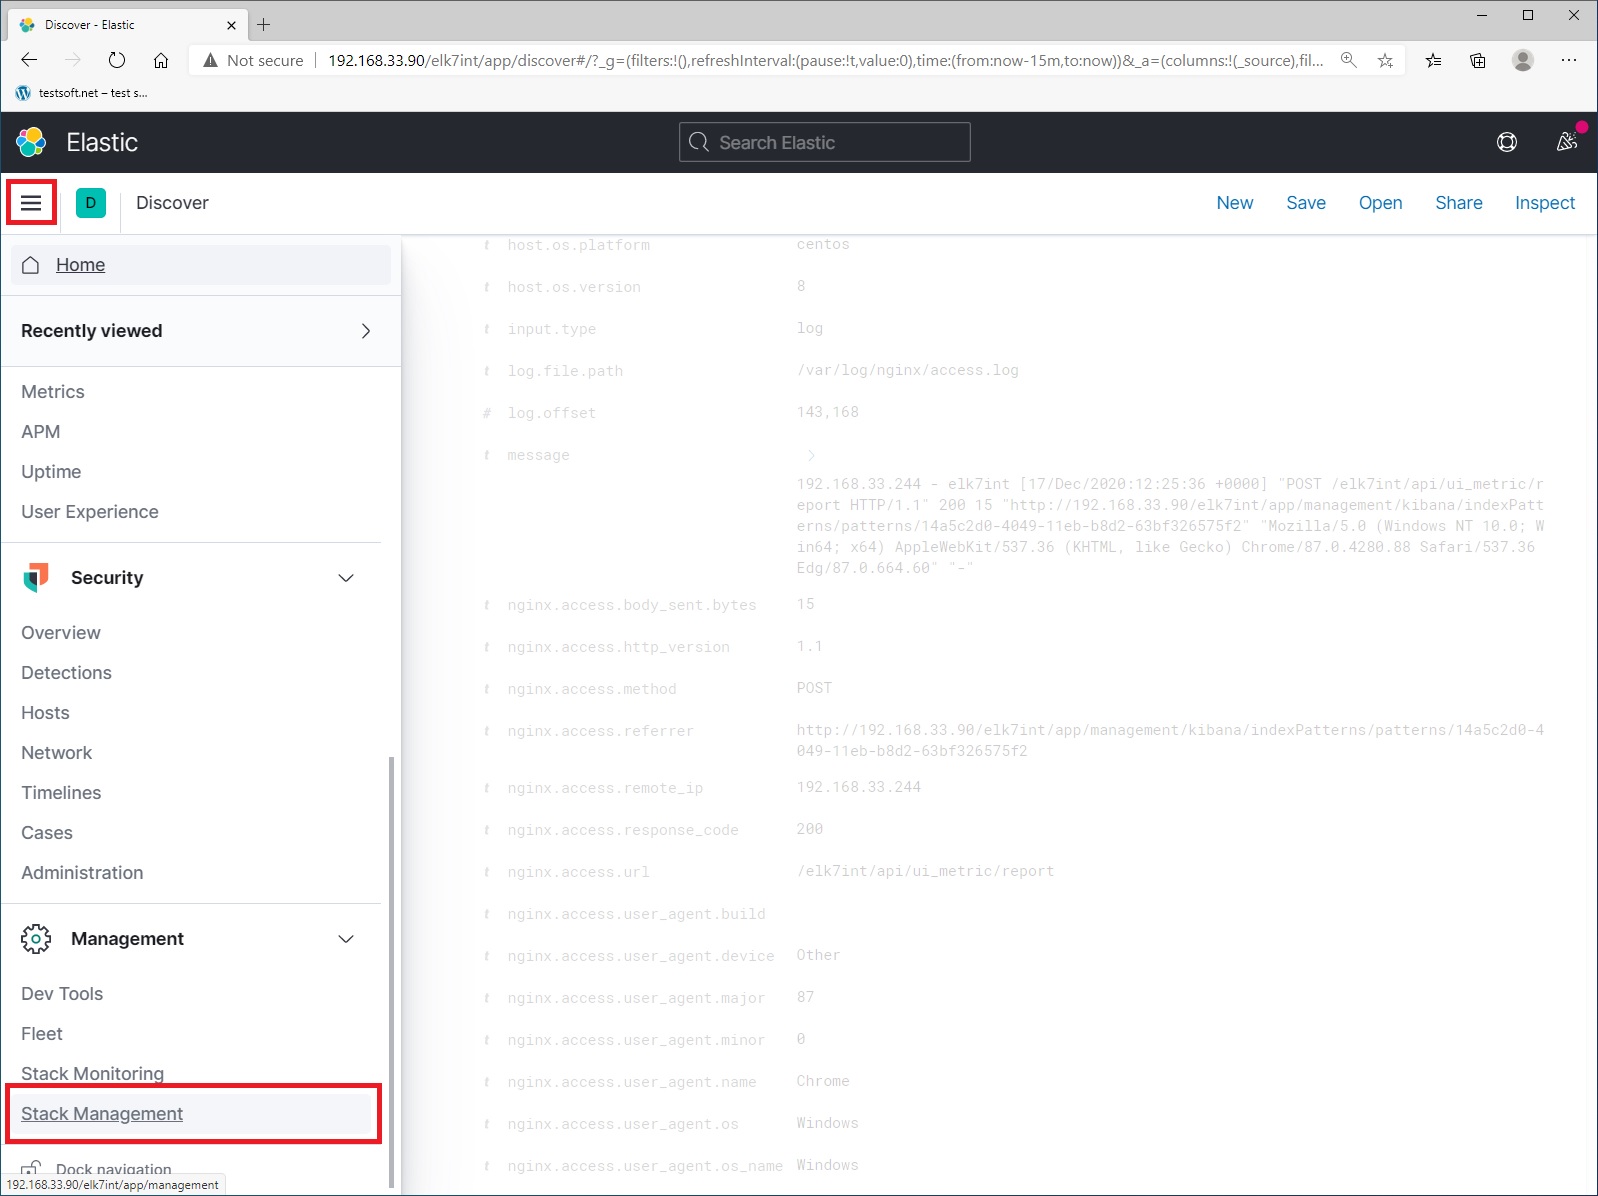
Now select menu item “Discover” in the left menu side (Picture 9).
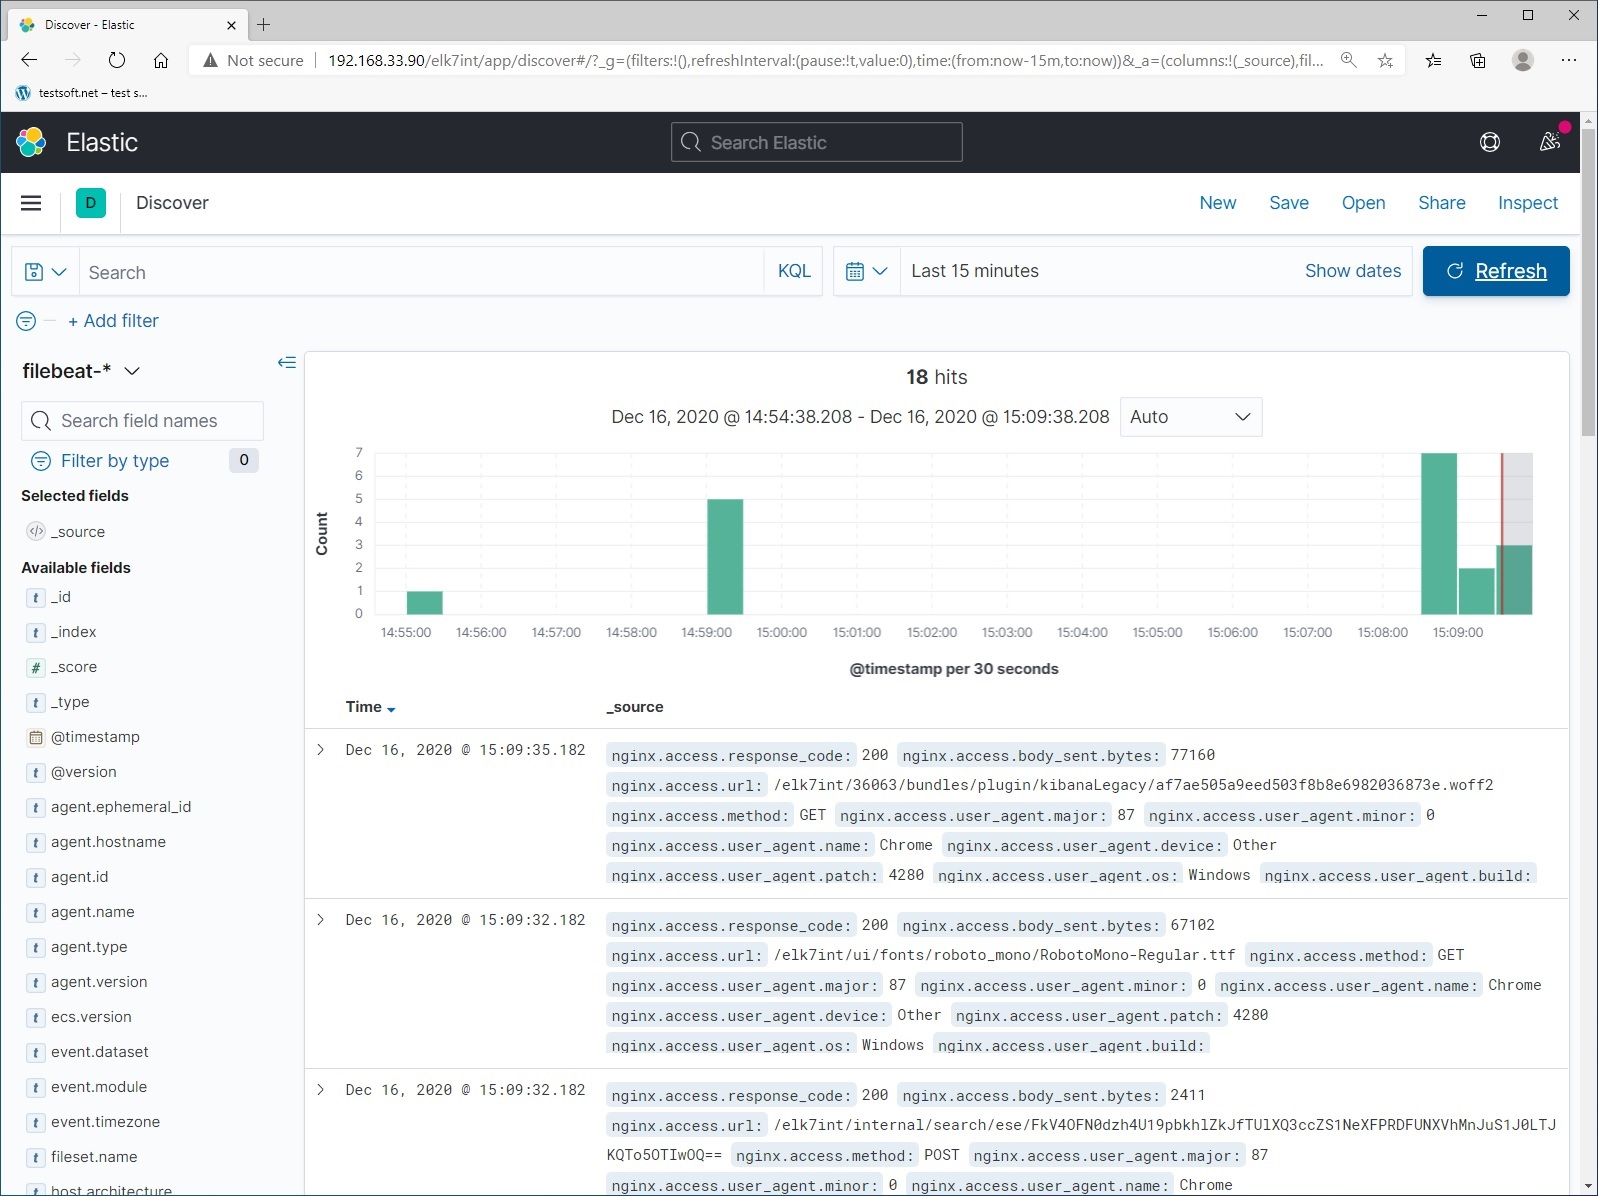
And explore local logs from elasticsearch server (Picture 10).
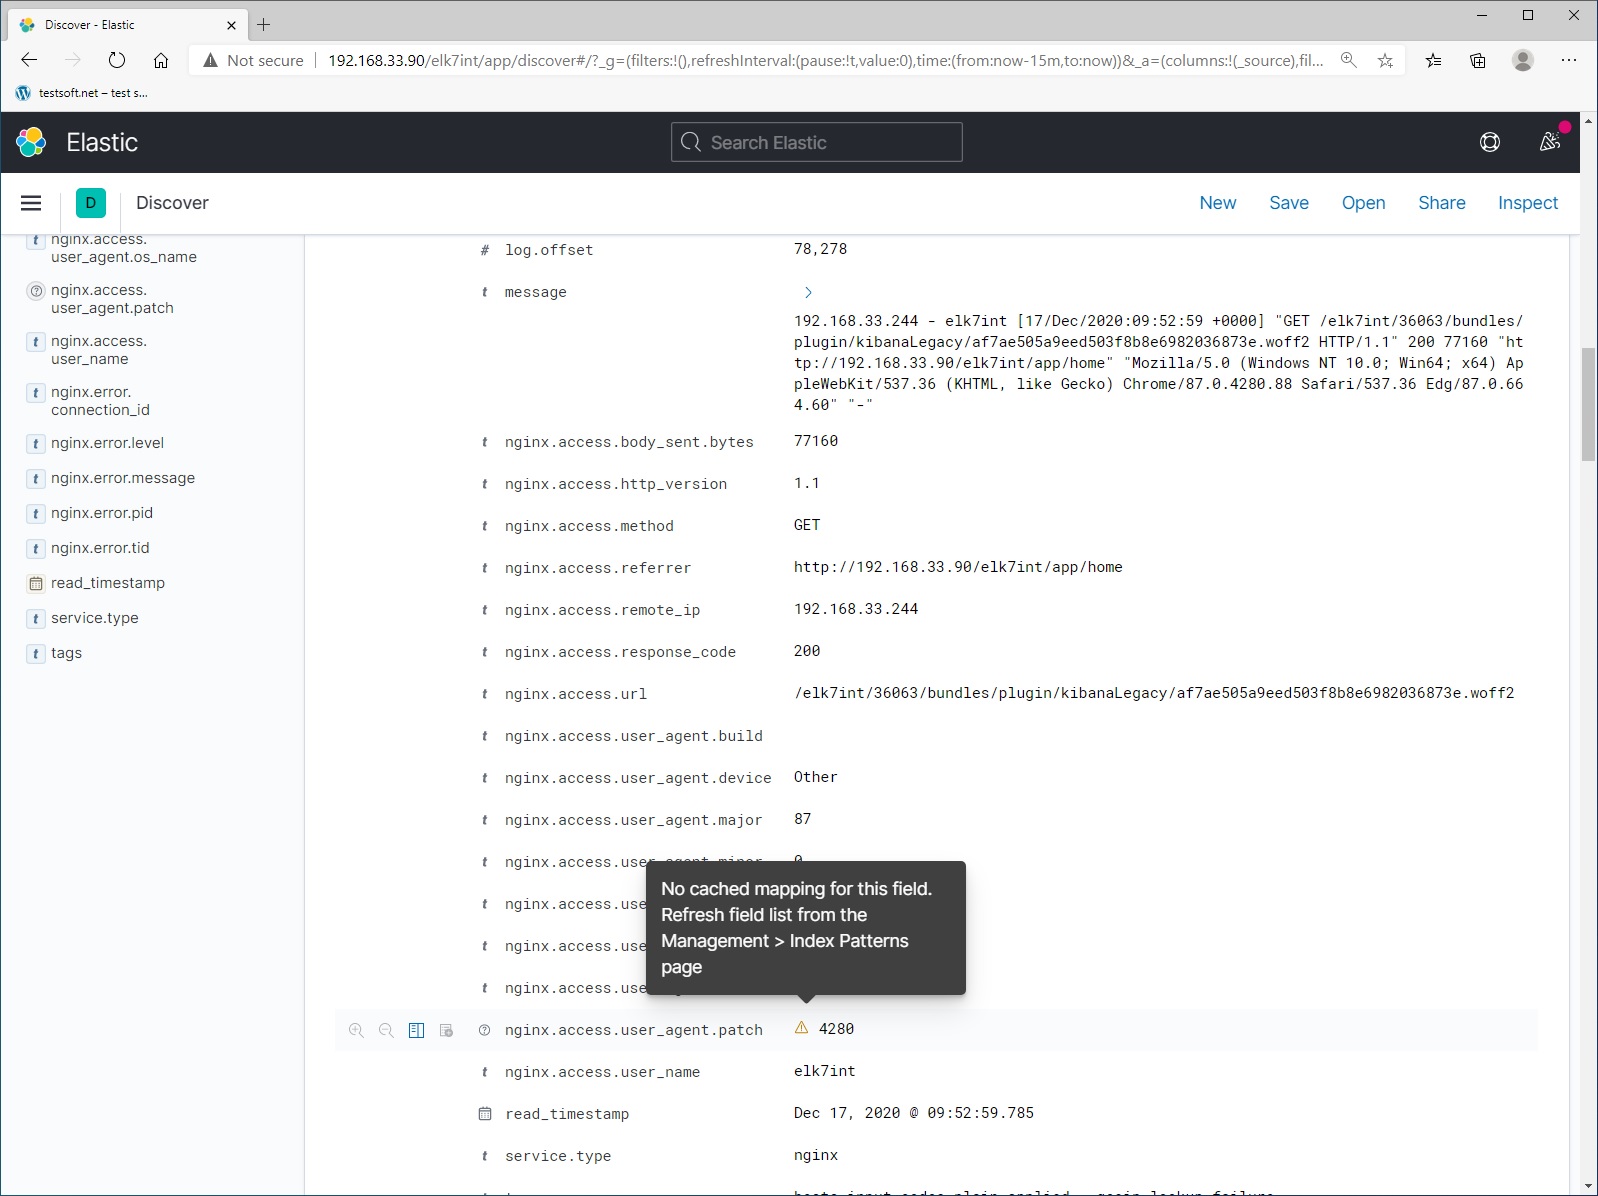
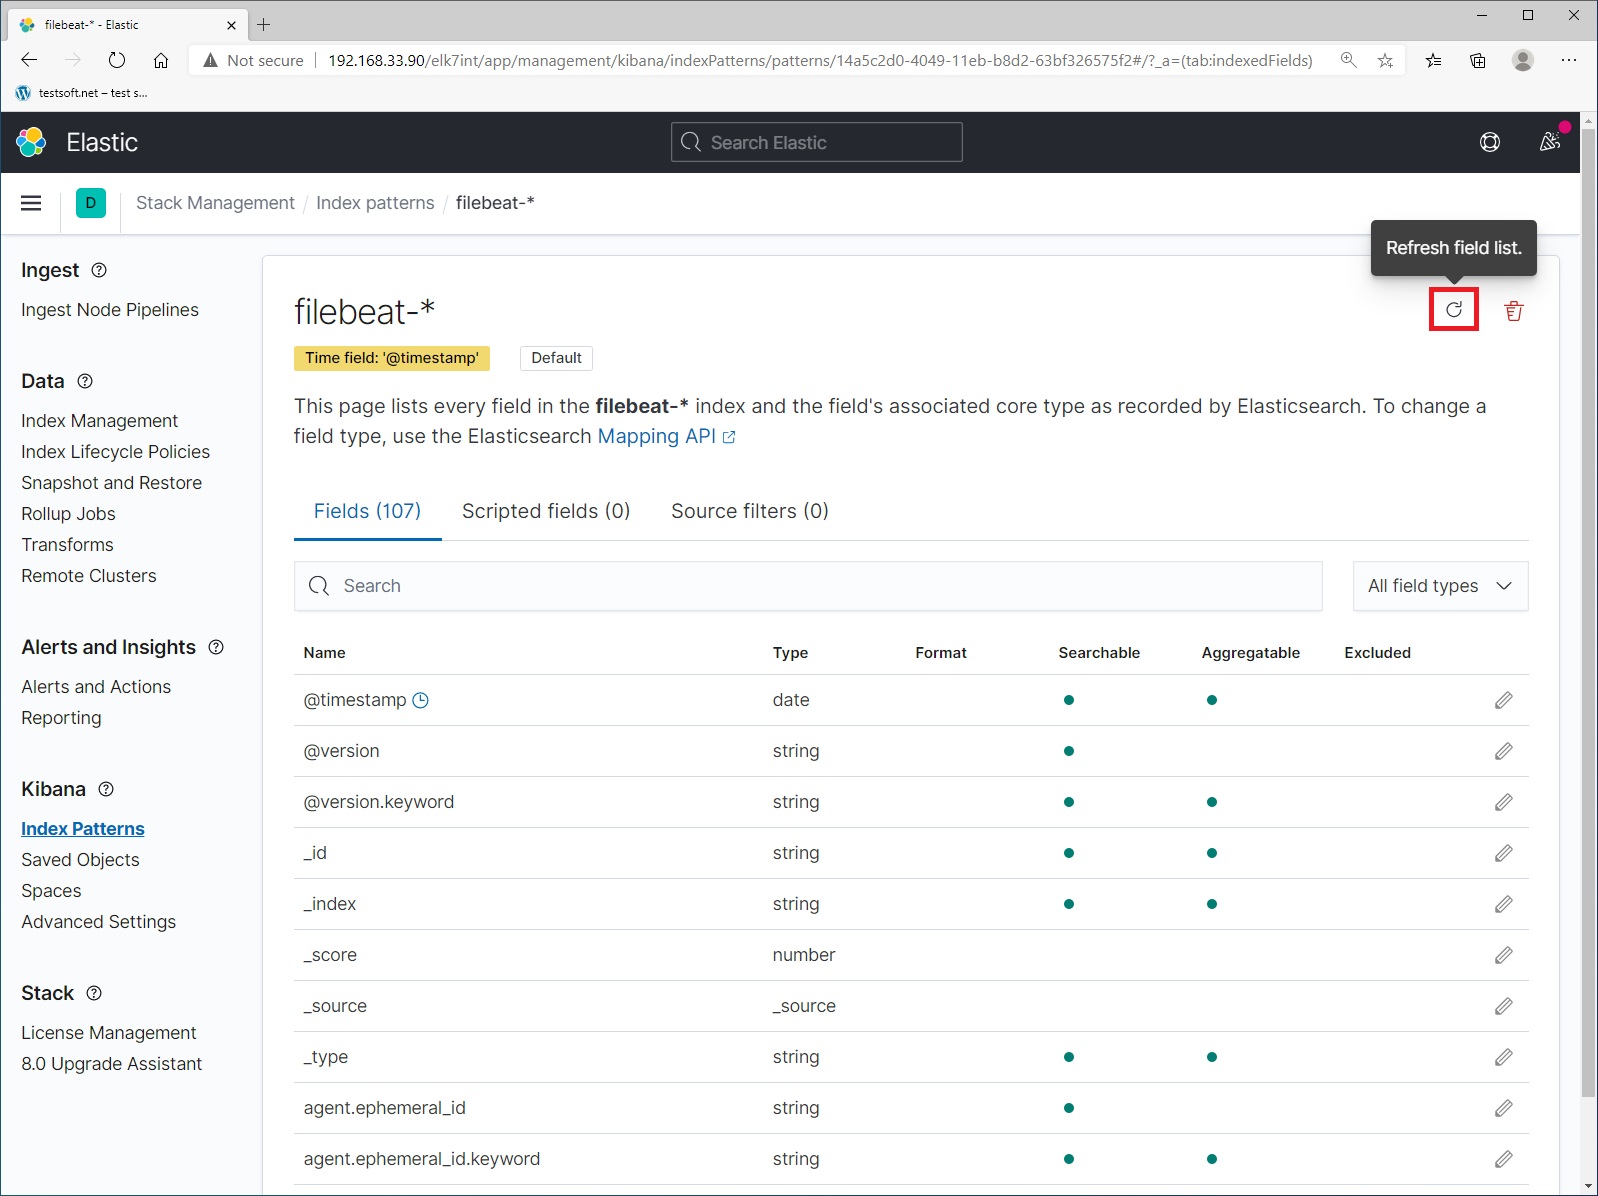
When working with elasticsearch, new data and fields will appear. New fields are marked with warning icons (Picture 11). If you see them, just update the index pattern:
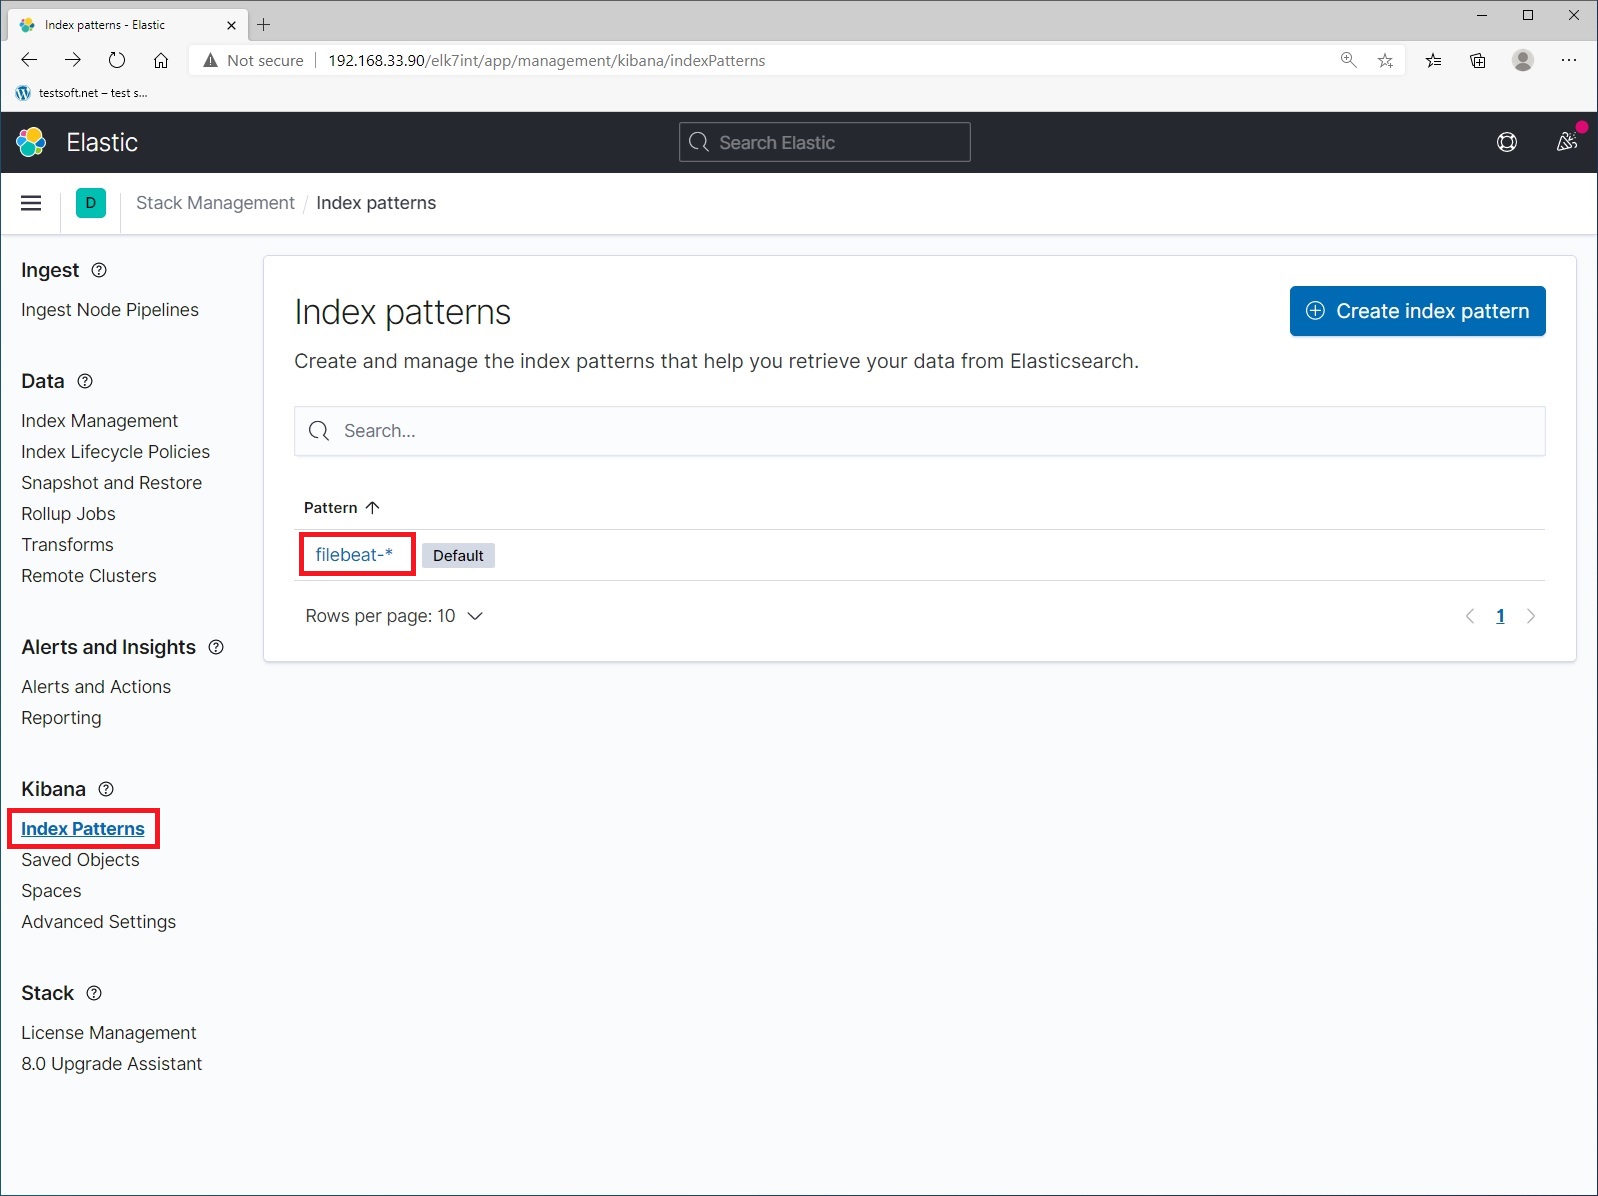
To update the index pattern, open left menu and select “Stack Management” (Picture 12)
On the “Stack Management” page, select “Index Patterns” and pattern “filebeat-*”
Refresh index pattern “filebeat-*”
Excellent, you have configured elasticsearch.
Next CHAPTER 2. REMOTE SERVER CONFIG FOR LOG SHIPING
CHAPTER 1. INSTALL AND CONFIG ELASTICSEARCH, LOGSTASH, KIBANA
Part 1.1. Install elastic search
Part 1.2. Install kibana and nginx proxy
Part 1.3. Install logstash on local ELK server
Part 1.4. Install filebeat for local ELK loging
Part 1.5. Create index for filebeat

CHAPTER 2. REMOTE SERVER CONFIG FOR LOG SHIPING (FILEBEAT)
Part 2.1. Filebeat install and config build-in modules for remote log shipping
Part 2.2. Filebeat setup for custom file read and log shipping